Kincentric’s Participation Monitor allows you to view your organization’s response rate progress during survey administration.
The Monitor is set up by Kincentric at the launch of the survey and may only be available to the people in your organization who are responsible for administering the survey. It allows you to monitor the participation rates of the survey broken out by a defined criteria.
In most cases you will see two options in the Score chart.
If your monitor is available in other languages;
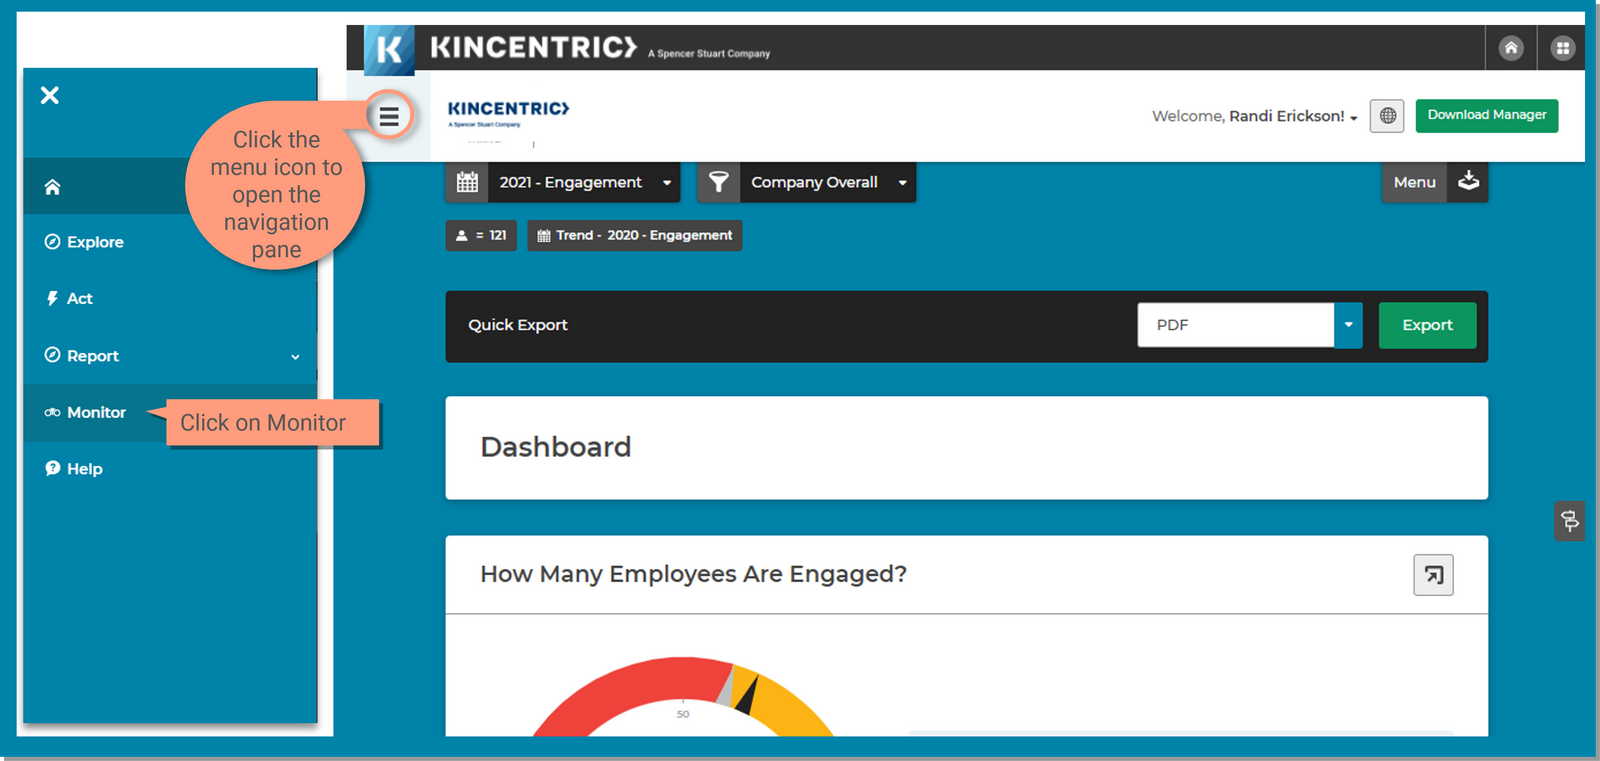
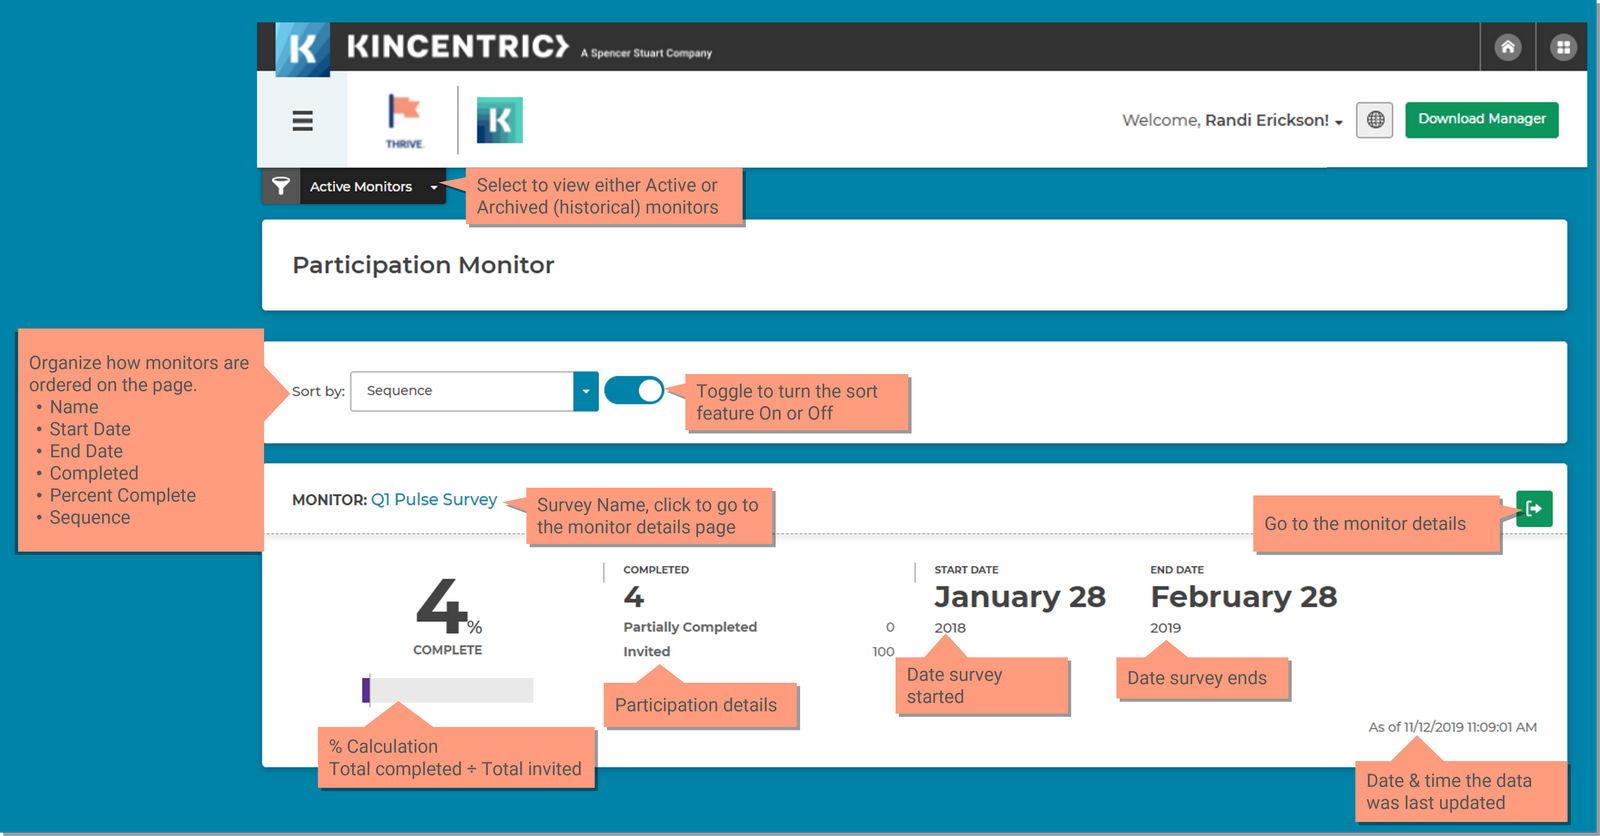
The dashboard is where you will see all of the monitors available to you. Click on the green button with an arrow to view the participation details of a monitor. There are several features on this page that allow you to customize how the monitors display on the page.
Active Monitors Filter: The default selected is Active Monitors which means only surveys that are currently active will display on the page by default. Use the filter when you want to view monitors for historical surveys that have been archived.
Sort By: When you have mulitiple monitors on the page, the 'Sort By' features will arrange them on the page according to the 'Sort By' option that you select. Use the drop down menu to select the desired sort order. If you want to turn off the sort order, click the toggle next to the drop down menu and the monitors will be displayed in alphabetical order according to the survey name.
Charts are Interactive, you can change the chart type and click within the chart to print, hide or show response options and hover to see the details.
The details page is where you will see the breakouts for your organization after you click the button on the dashboard homepage to navigate to the monitor details. Features on this page include:
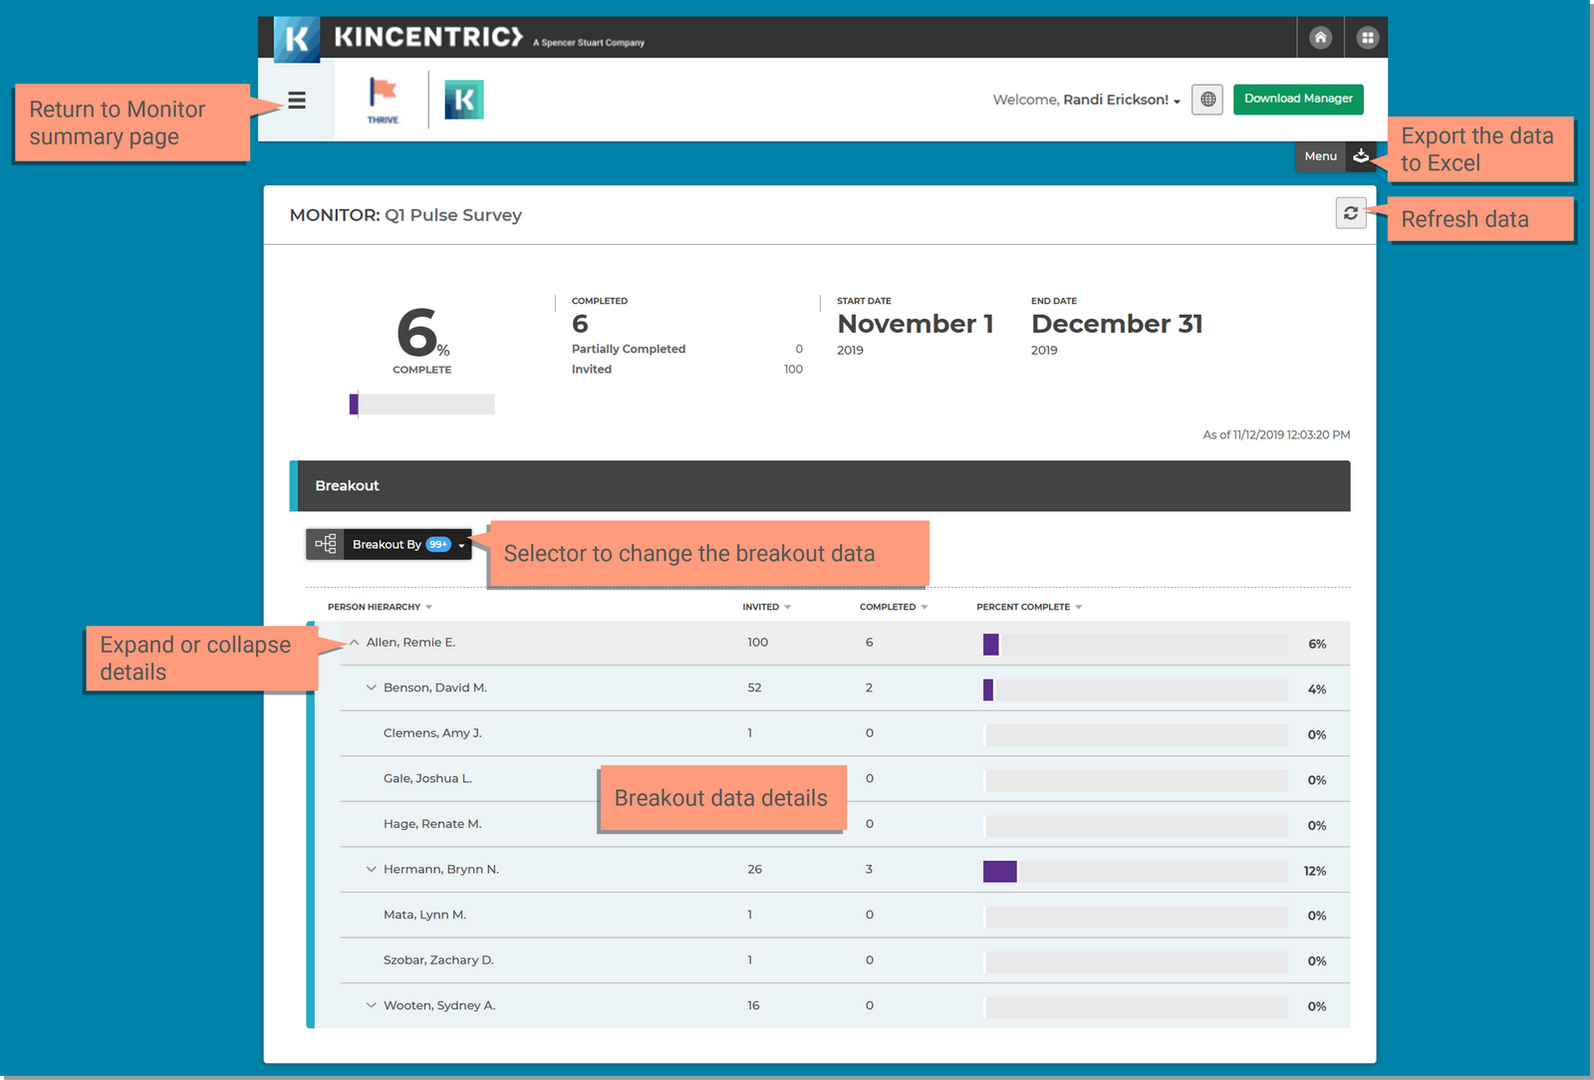
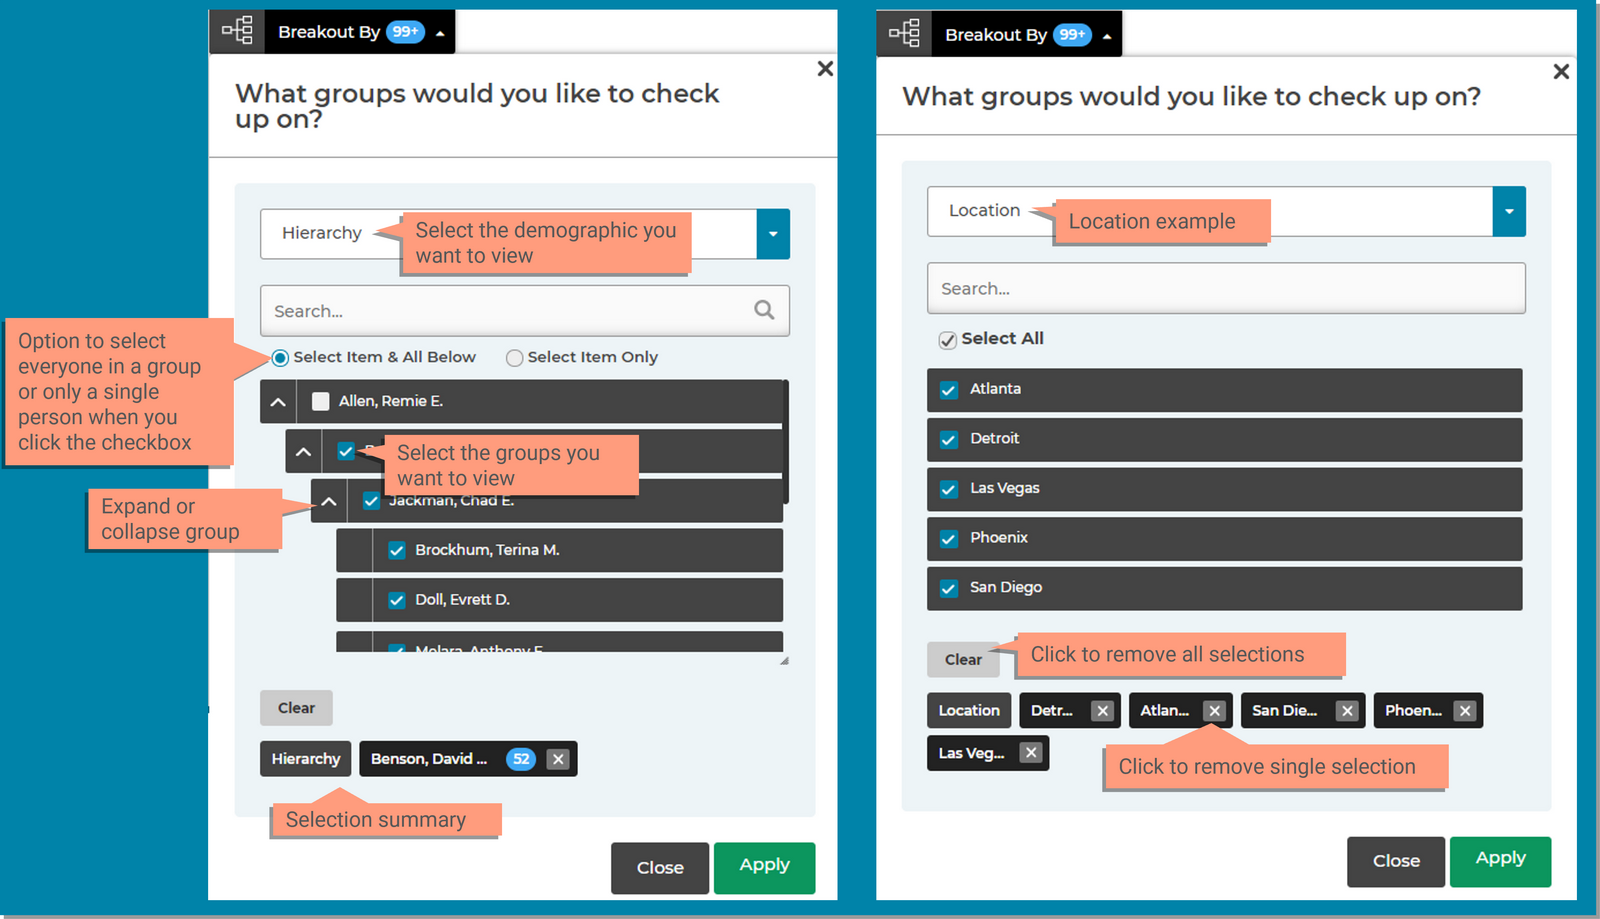
The Breakout By tool allows you to choose which breakouts and values to display on the page.
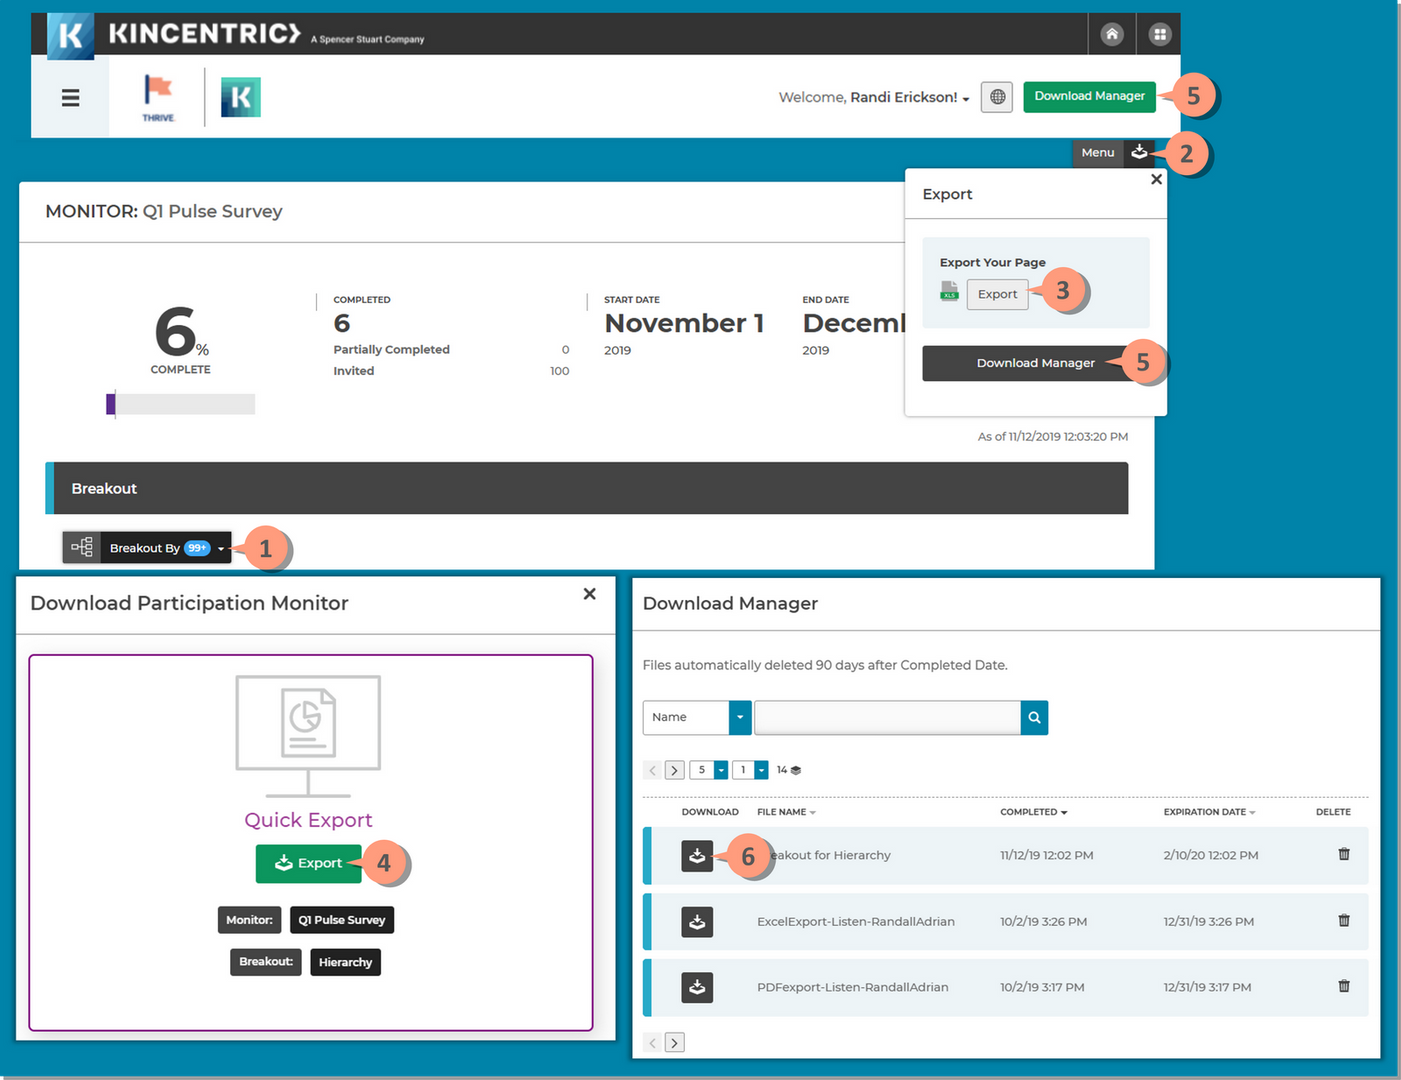
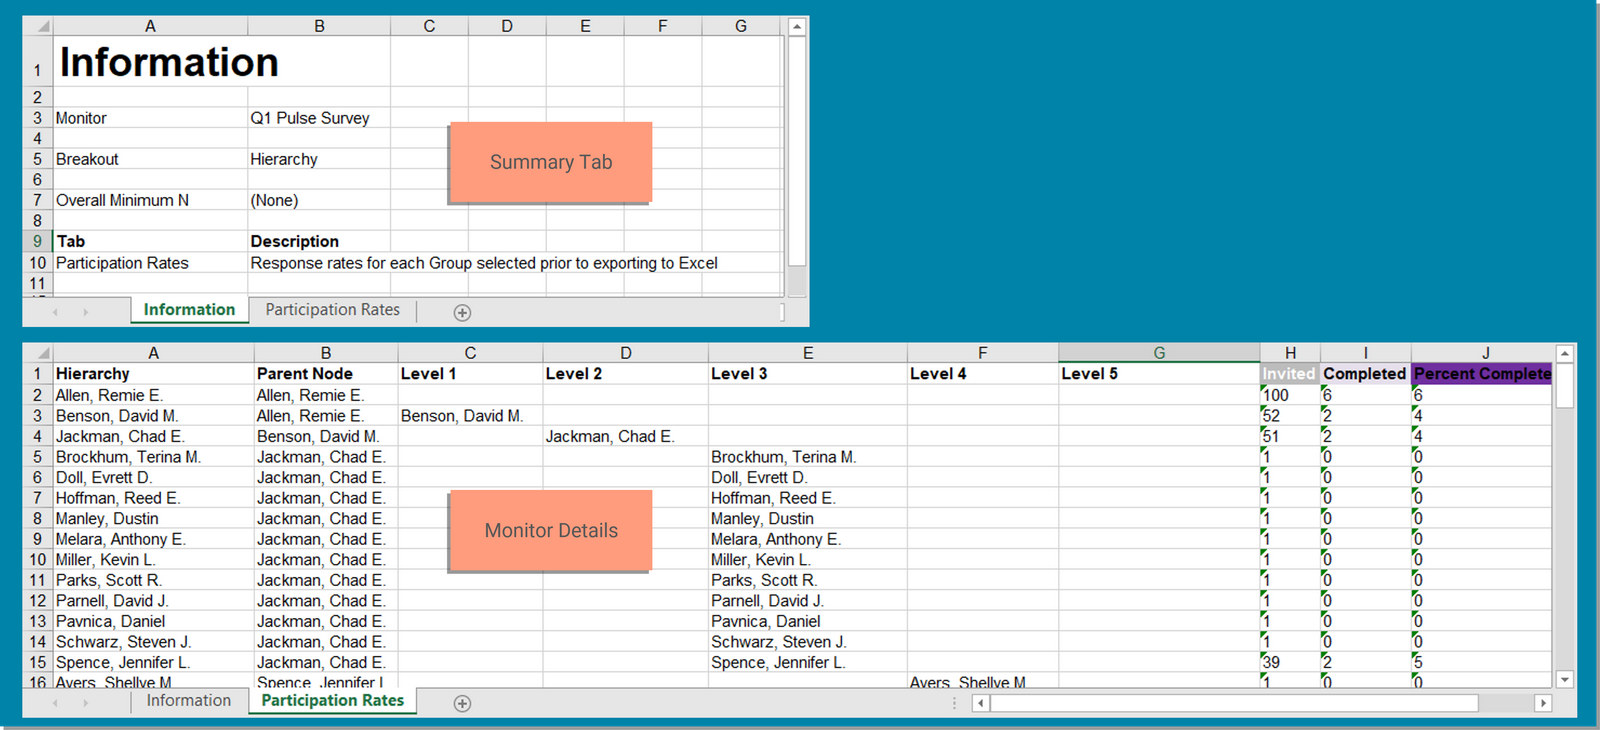
The export functionality will export everything that is currently showing on the screen.