Data can be exported multiple ways on the site, no matter how or what you download the results will appear in the language you're viewing the site in.
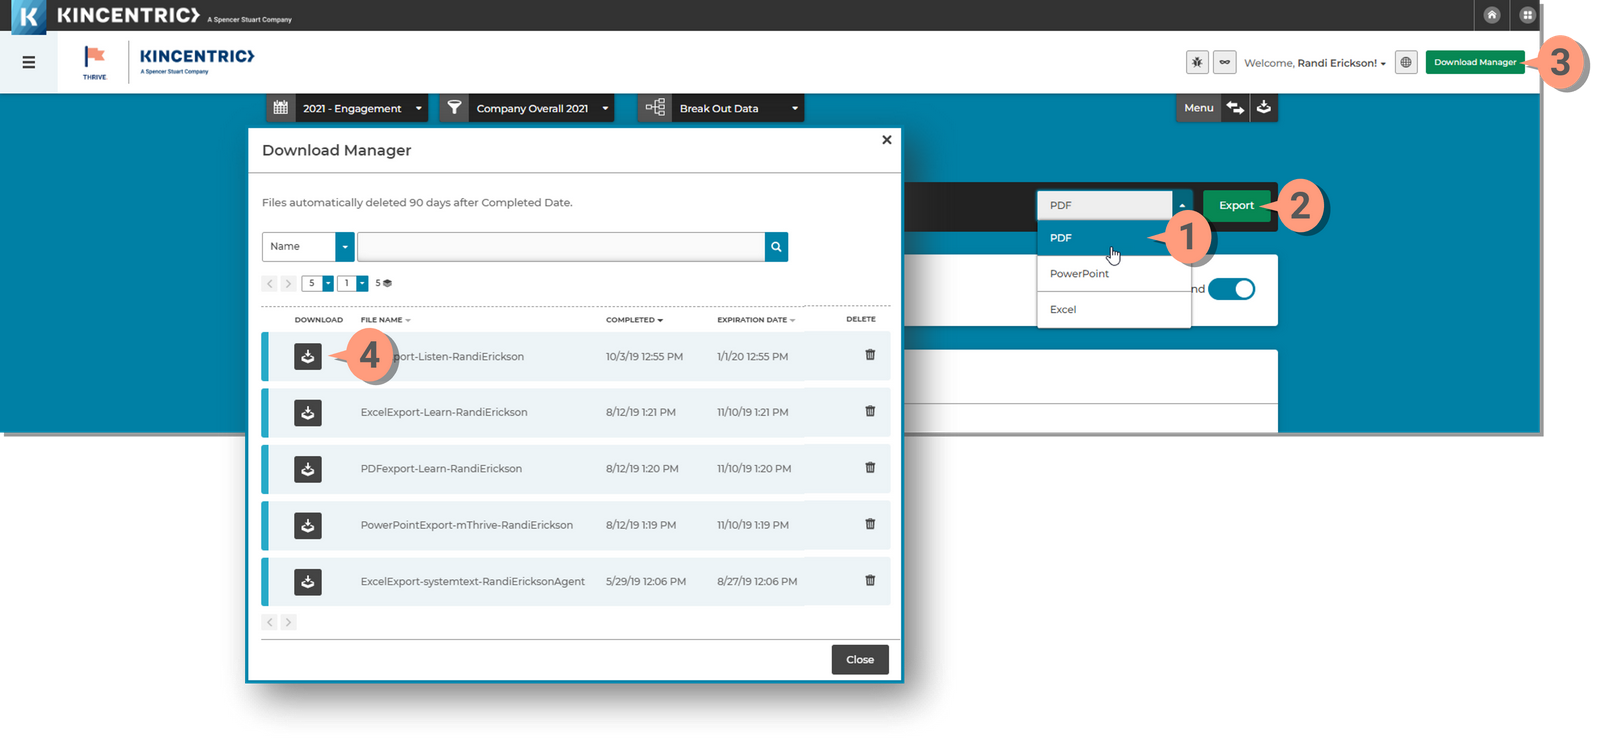
All exports are available within the Download Manger which will appear when clicking the Download Menu on each page. Exports are available for 90 days after generation. Some of the options that appear as selections will vary depending on the page you're downloading from.
There are two ways to download:

The options in the Quick Export Banner dropdown will vary depending upon the page you are on in the reporting application.
How to use the Quick Export Banner

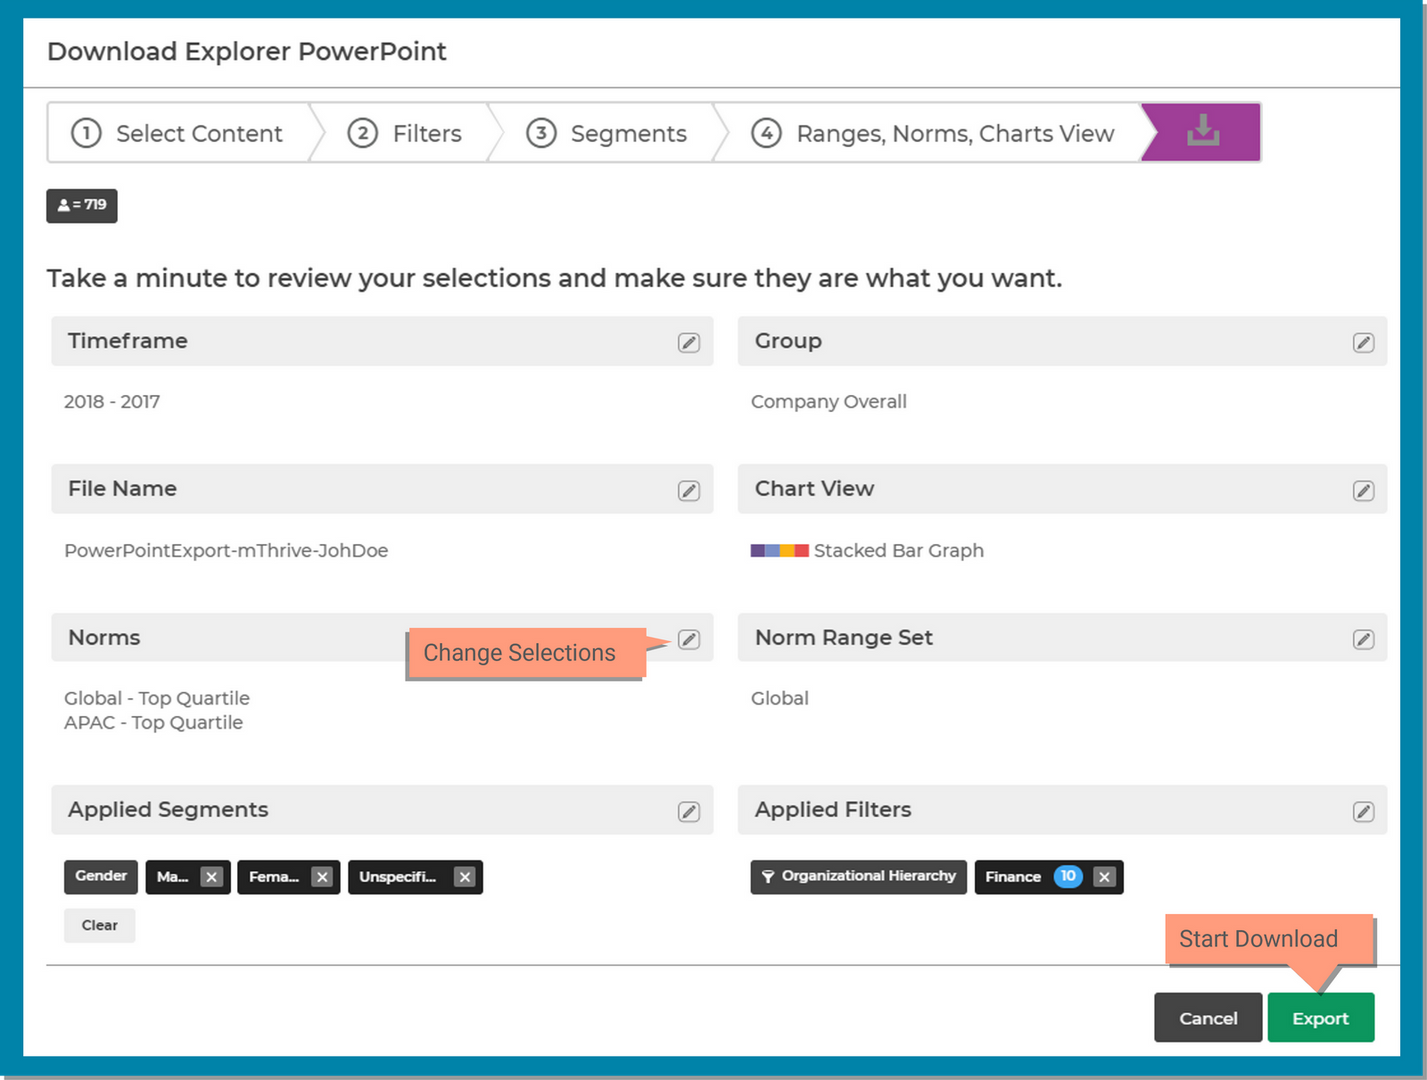
Regardless of the options, the download process will include these steps for each page:
The download options vary depending on what page you are on and what format you want downloaded. Review the section below that applies to your download.
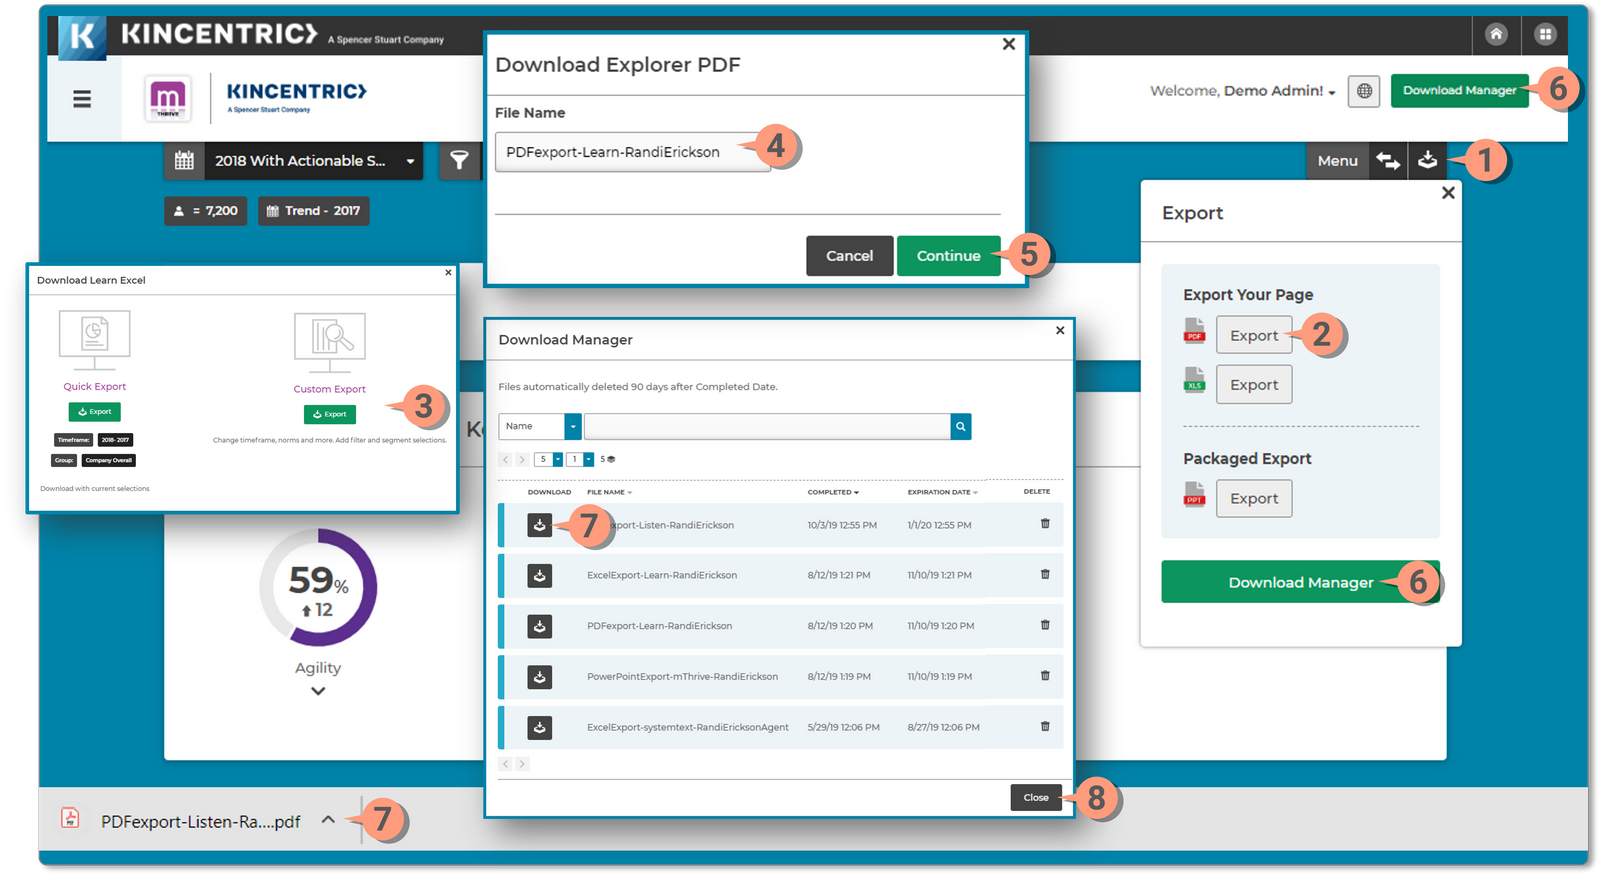
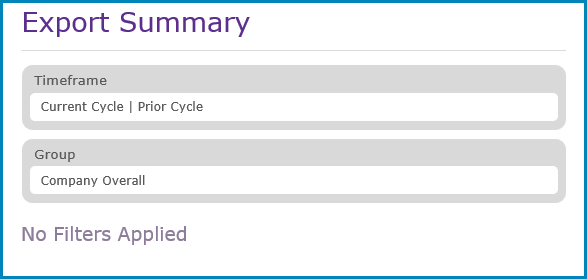
Download a PDF of your results summary by clicking on the Export button next to the PDF icon.
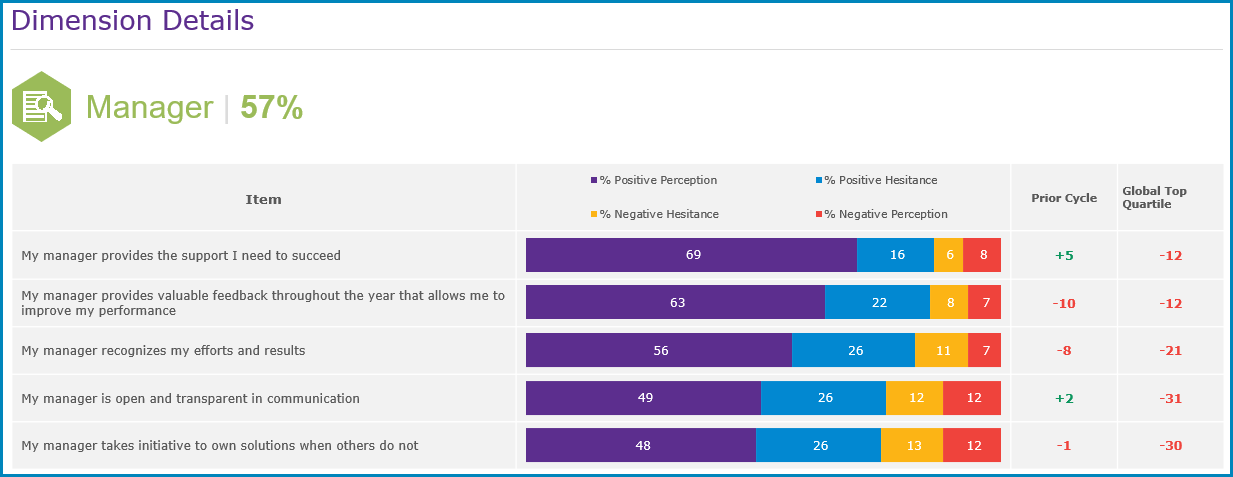
This report view will export based on any configurations you have done in the modal prior to exporting the PDF. For example, if you select All Items and sort by percent favorable, this view will show in your export. The export includes:
In the Download Manger, the PDF file will be prefixed with PDFexport. Depending on what browser you use and the settings, when you click the download button the file will either open in a new tab or become available in your computer 'Downloads' folder.
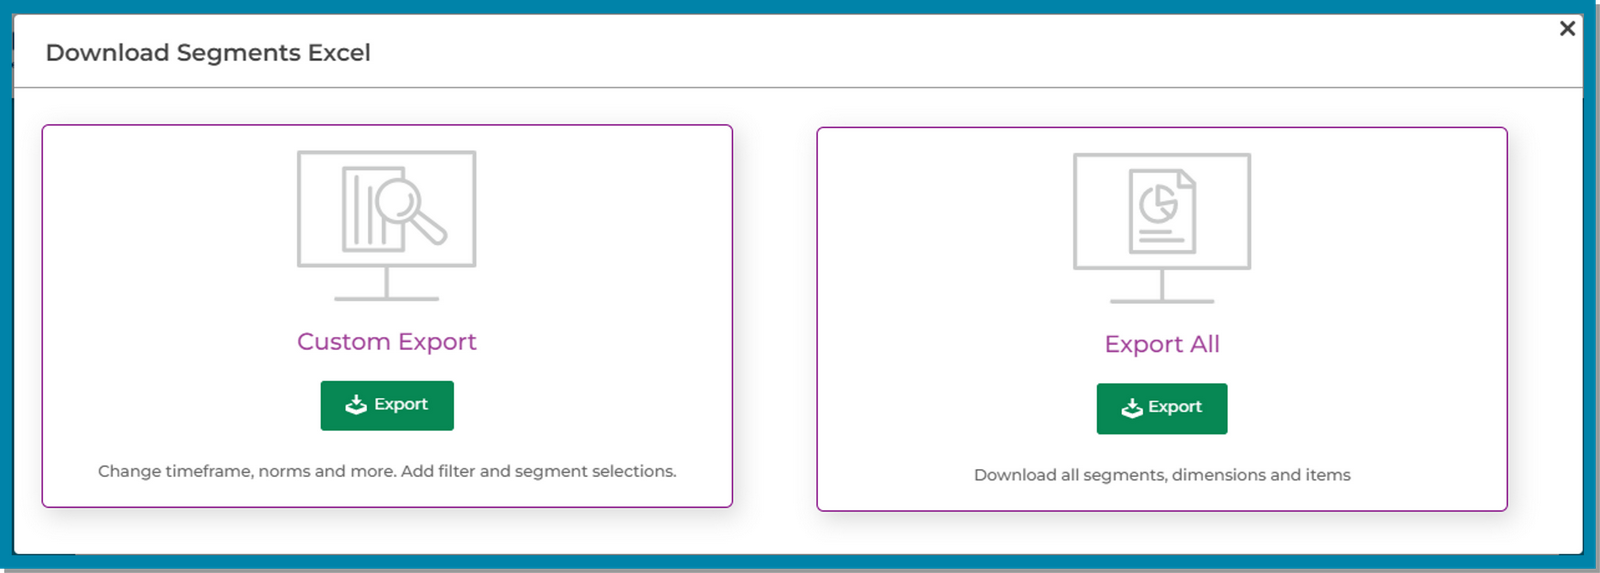
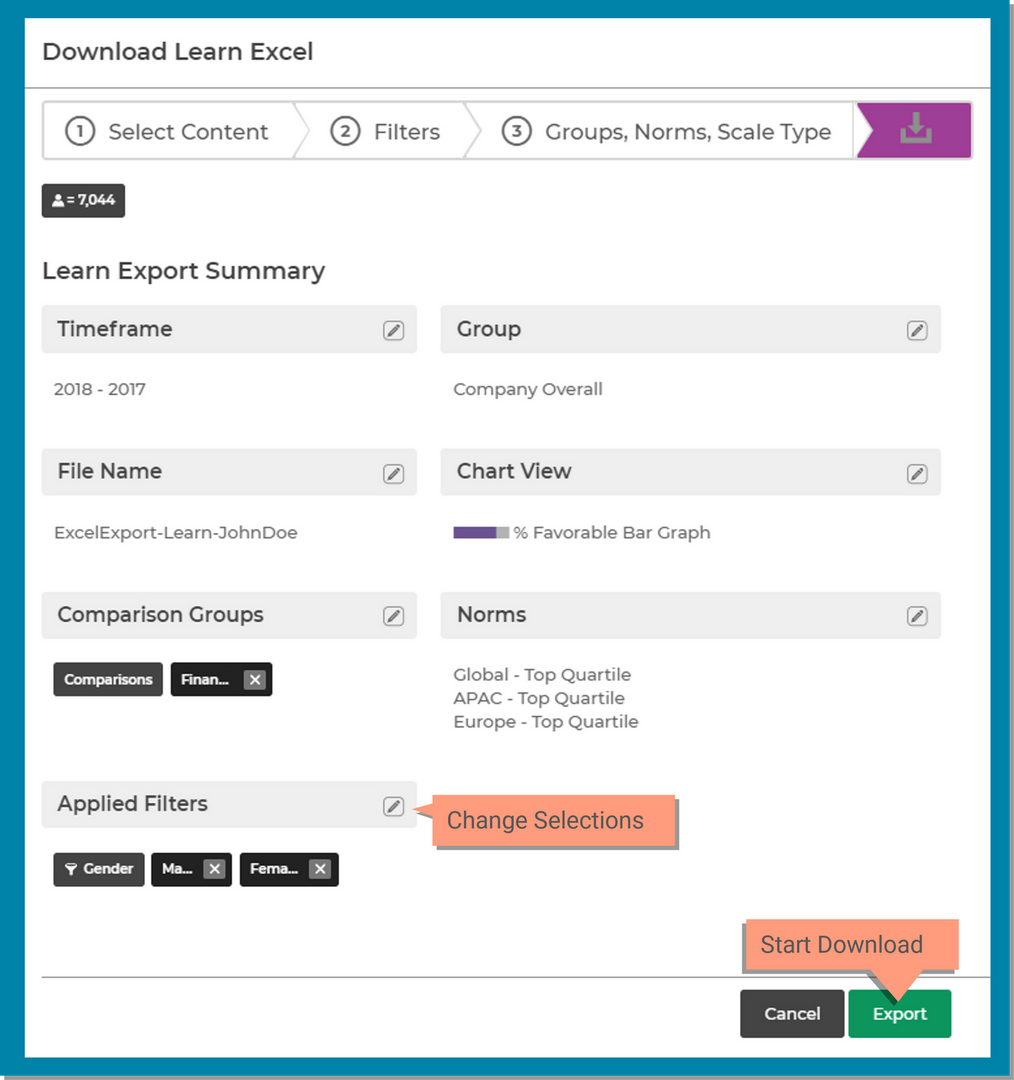
You can download results into Excel from Learn or Segment. Start by clicking on the Export button next to the XLS icon in the download menu.
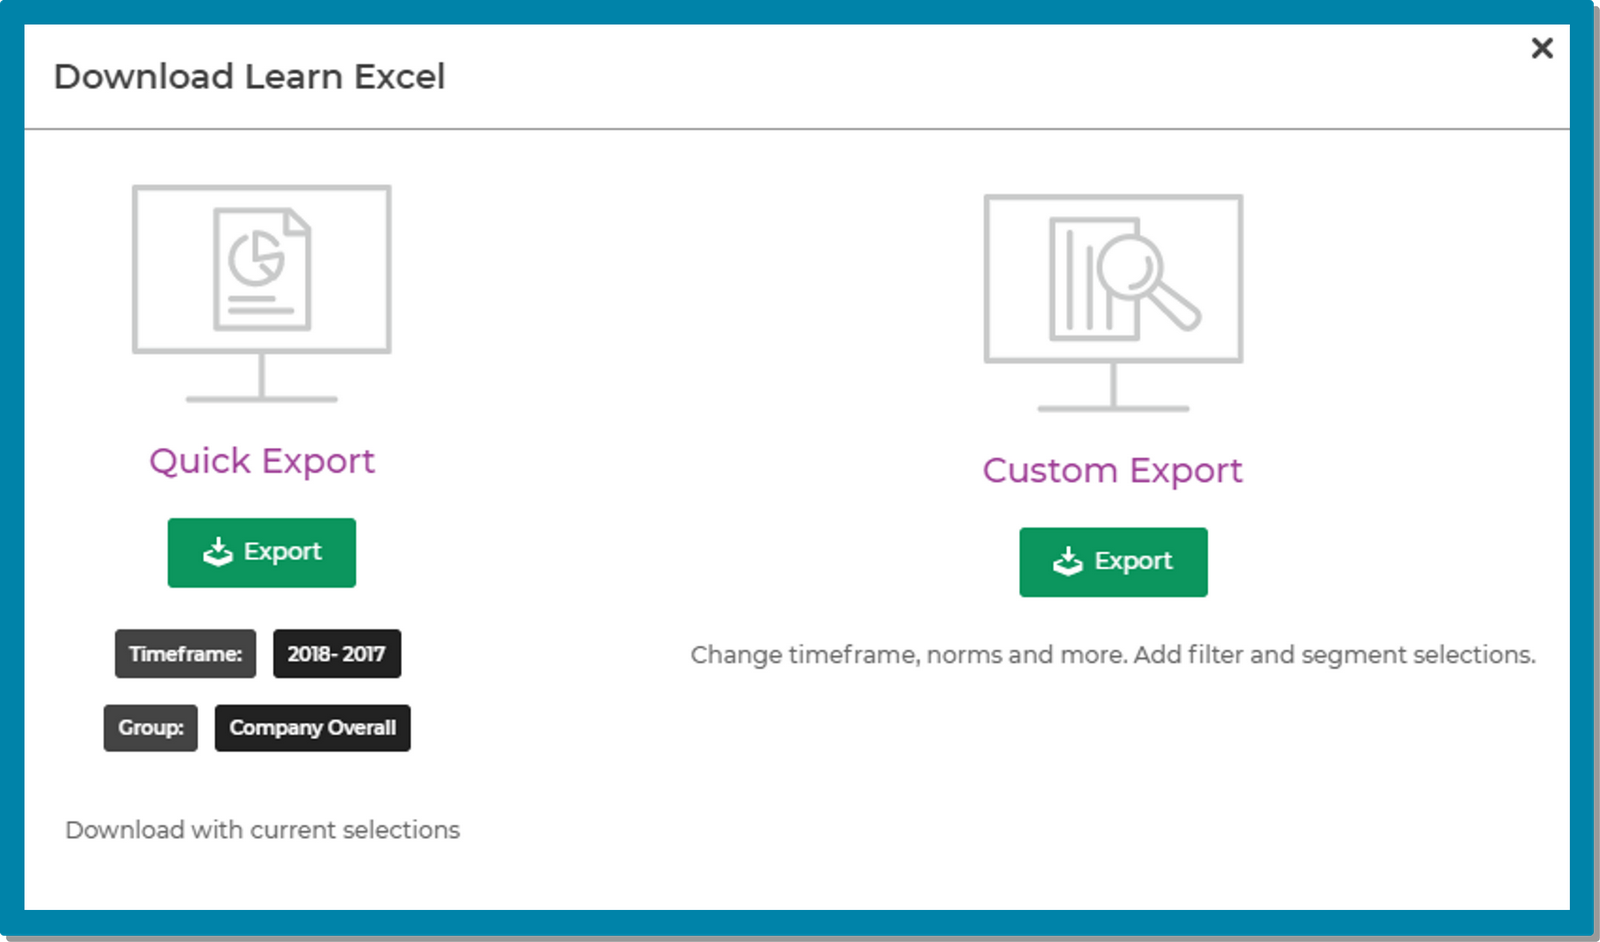
You have the option to select between a Custom Export or and Export All.
Export verbatim comments from the Listen page.
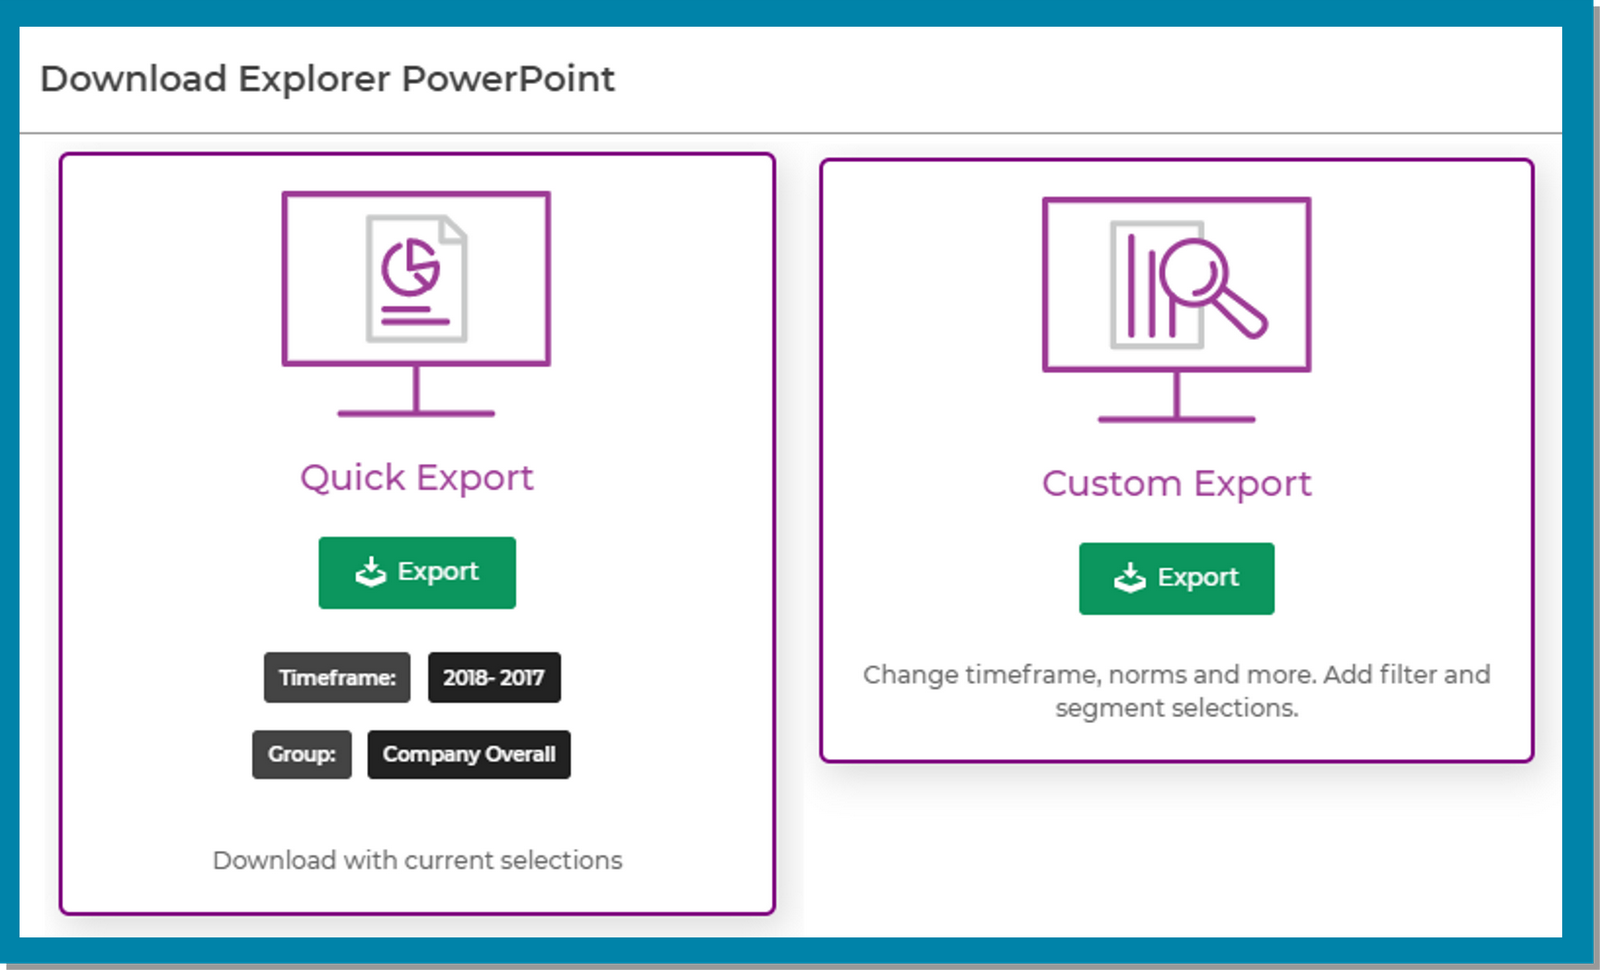
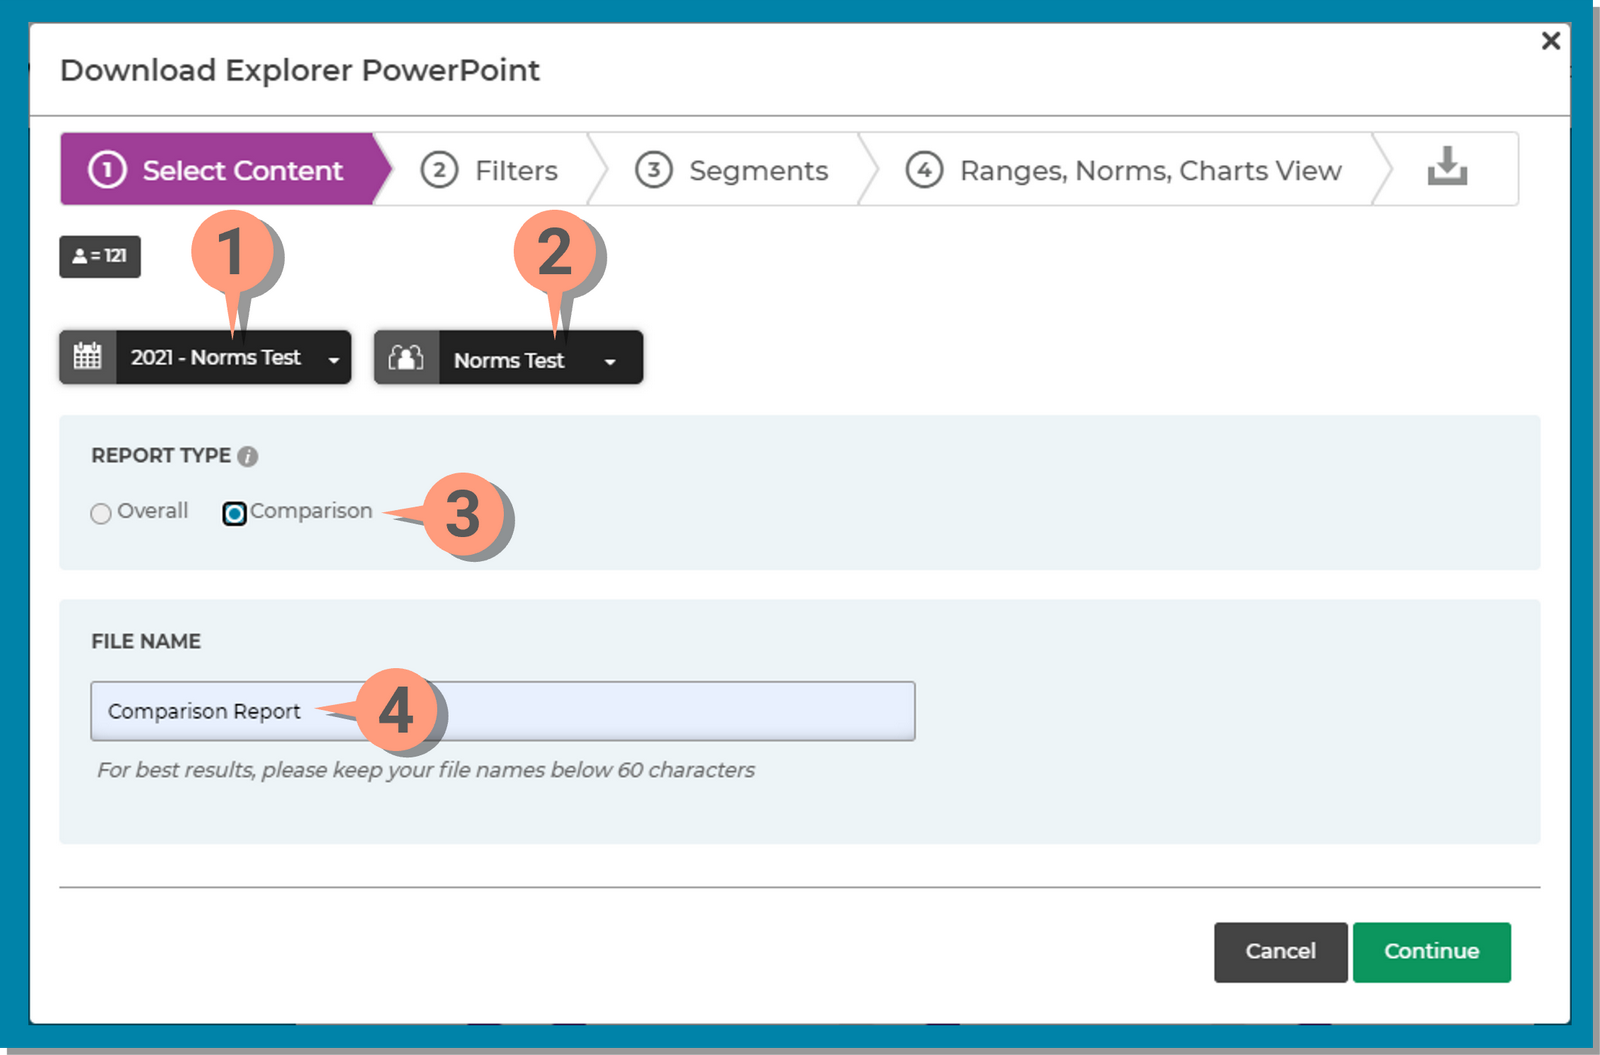
You can easily download a PowerPoint report of your results by clicking on the export button next to the PPT icon in the download menu.
When you select a Custom report, you will be required to make specific selections. Below we provide the details on how to navigate through the option selectors. Each Report has different selection options.
A. Select Content - This section allows you to define the following:
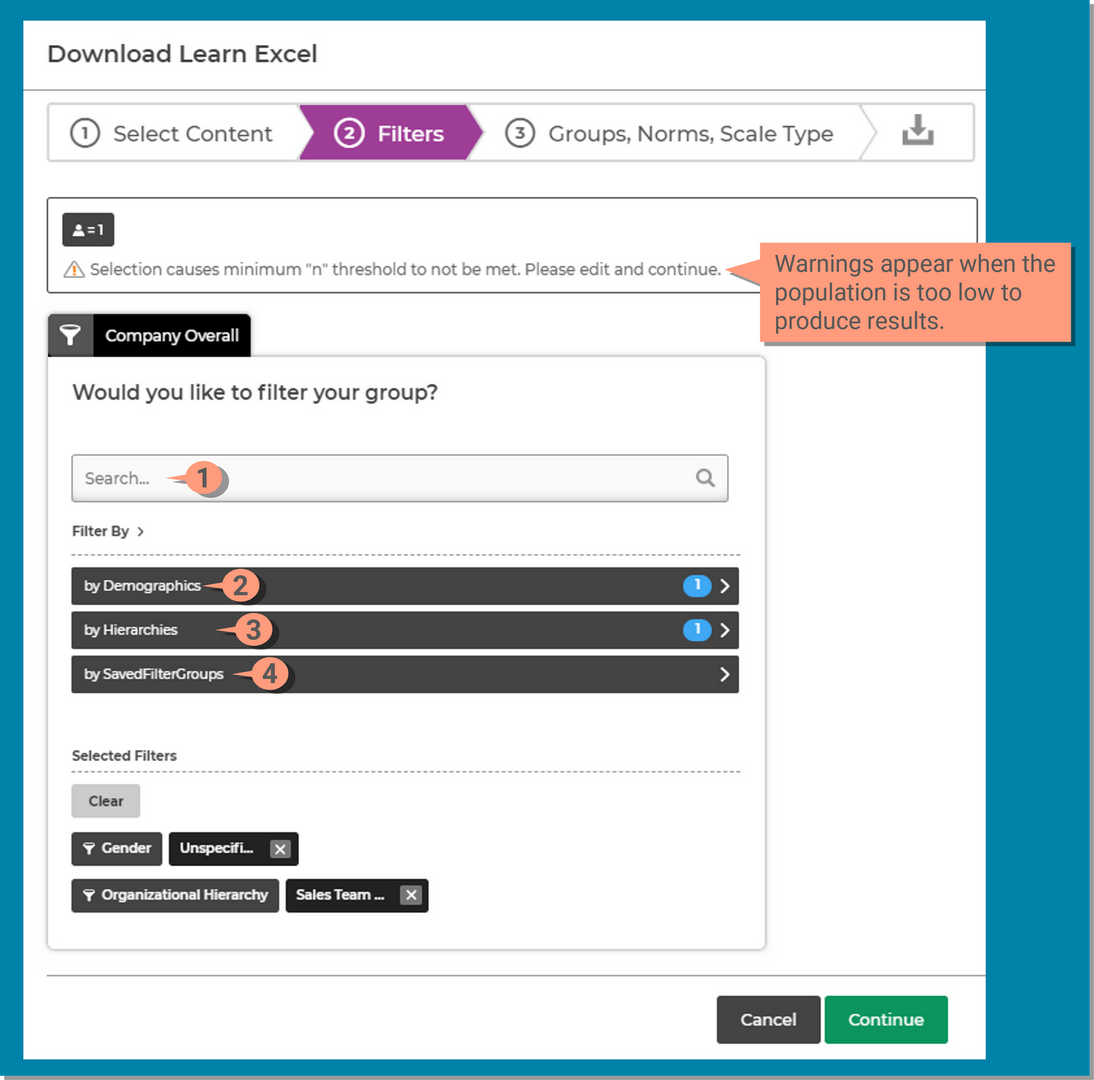
B. Filters - Allows you to select demographics and hierarchy. This is the same filter that is found at the top of every page and functions the same.
The following selections will change depending upon if you are on the Learn page or Segment page when clicking the report options and if you are exporting an Excel or PowerPoint report.
Expand the section below to view the desired option for further instructions.
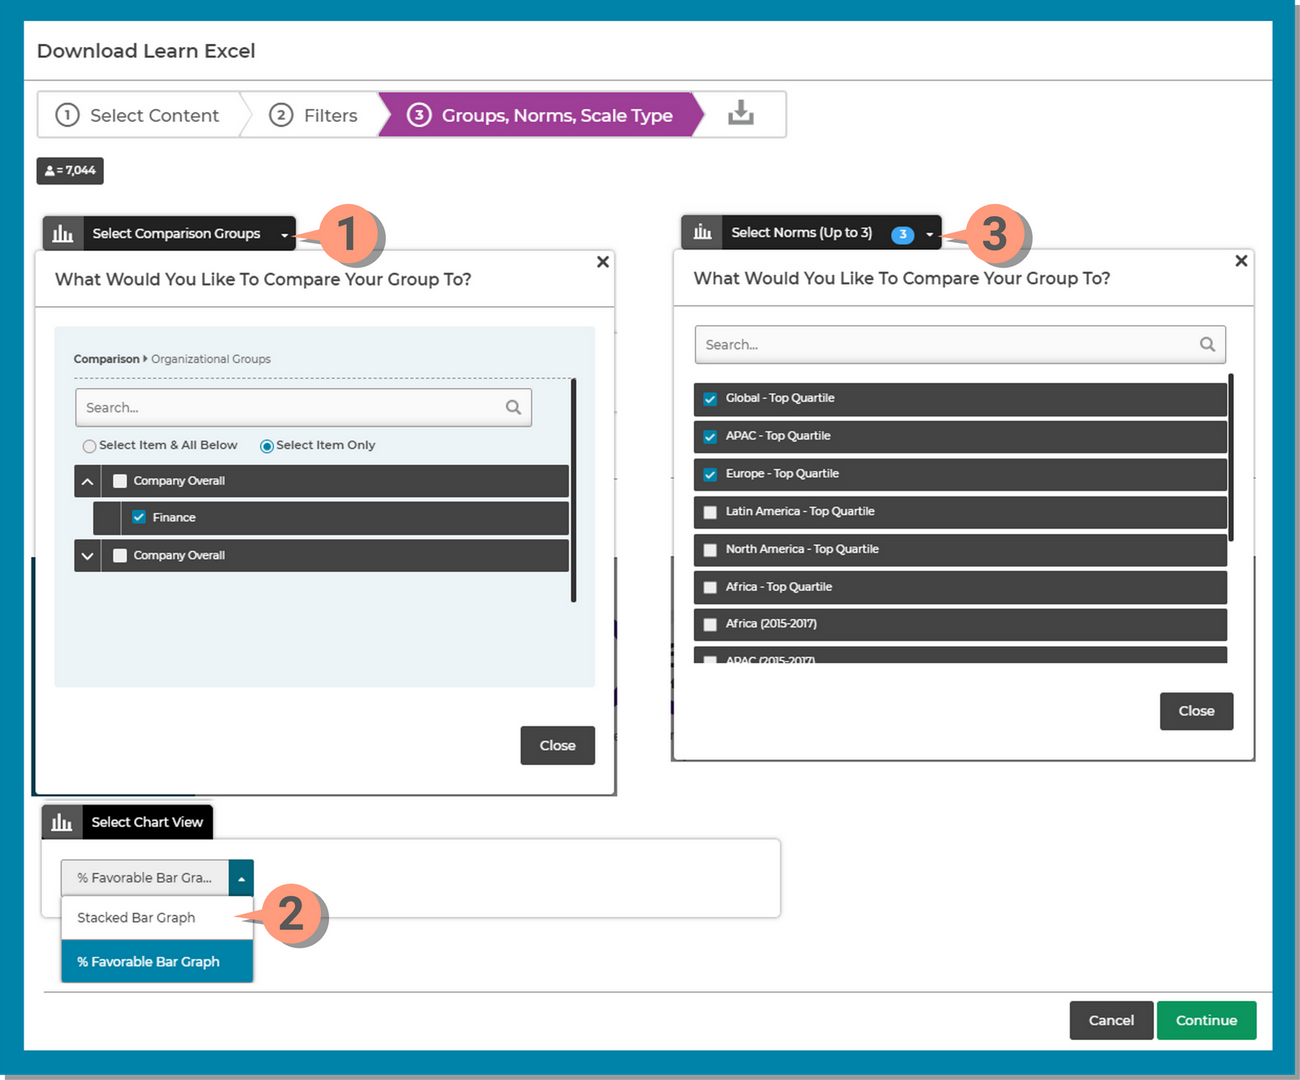
Downloading Excel from the Learn page will have a unique step specific to the Learn page: 3) Groups, Norms, Scale Types
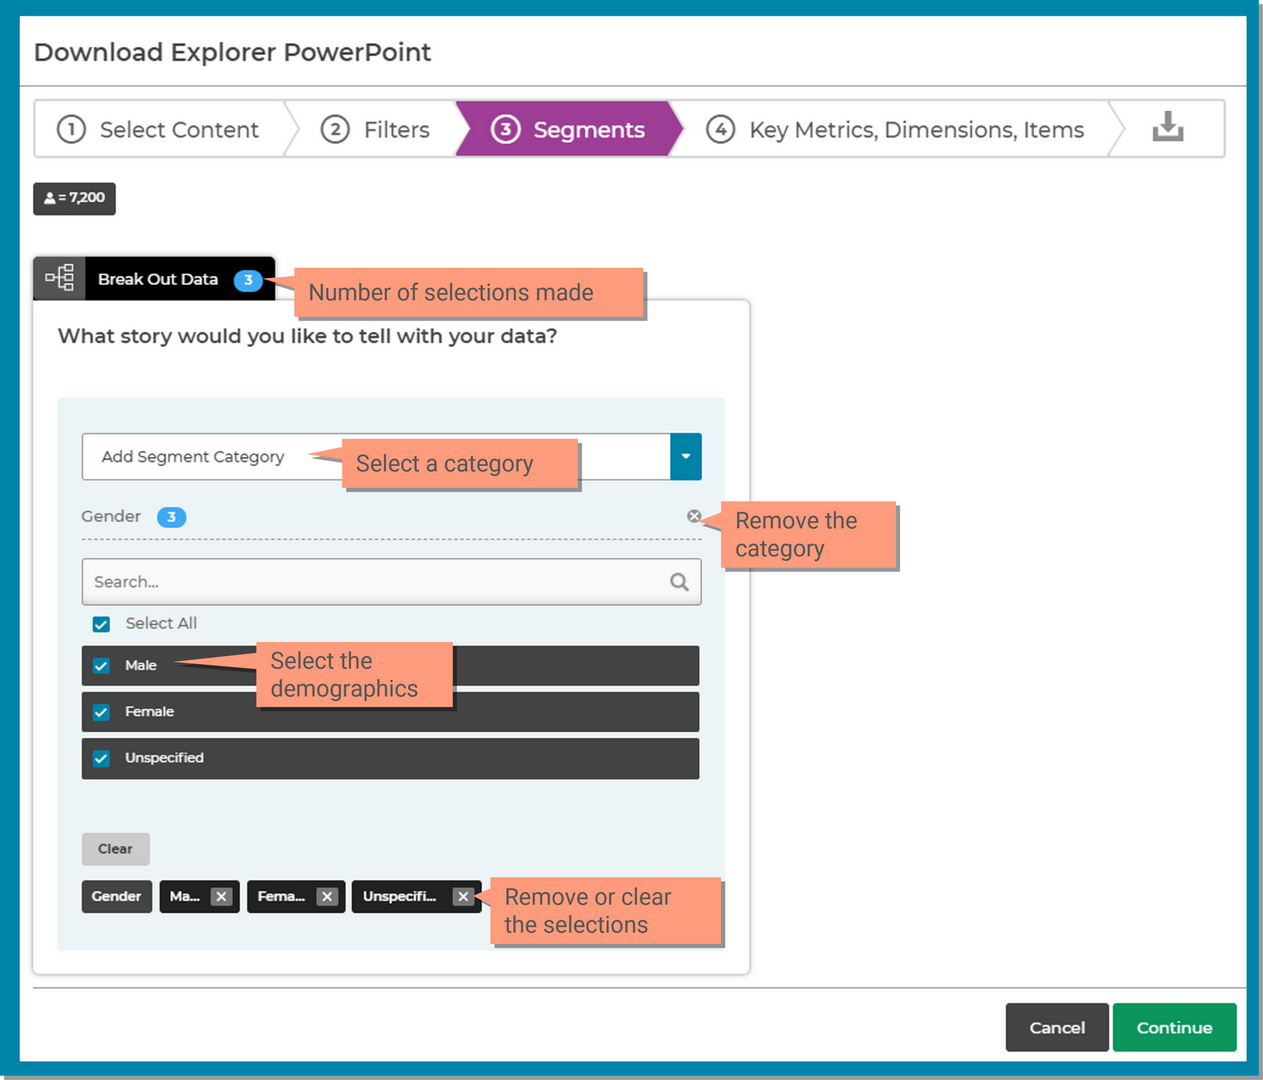
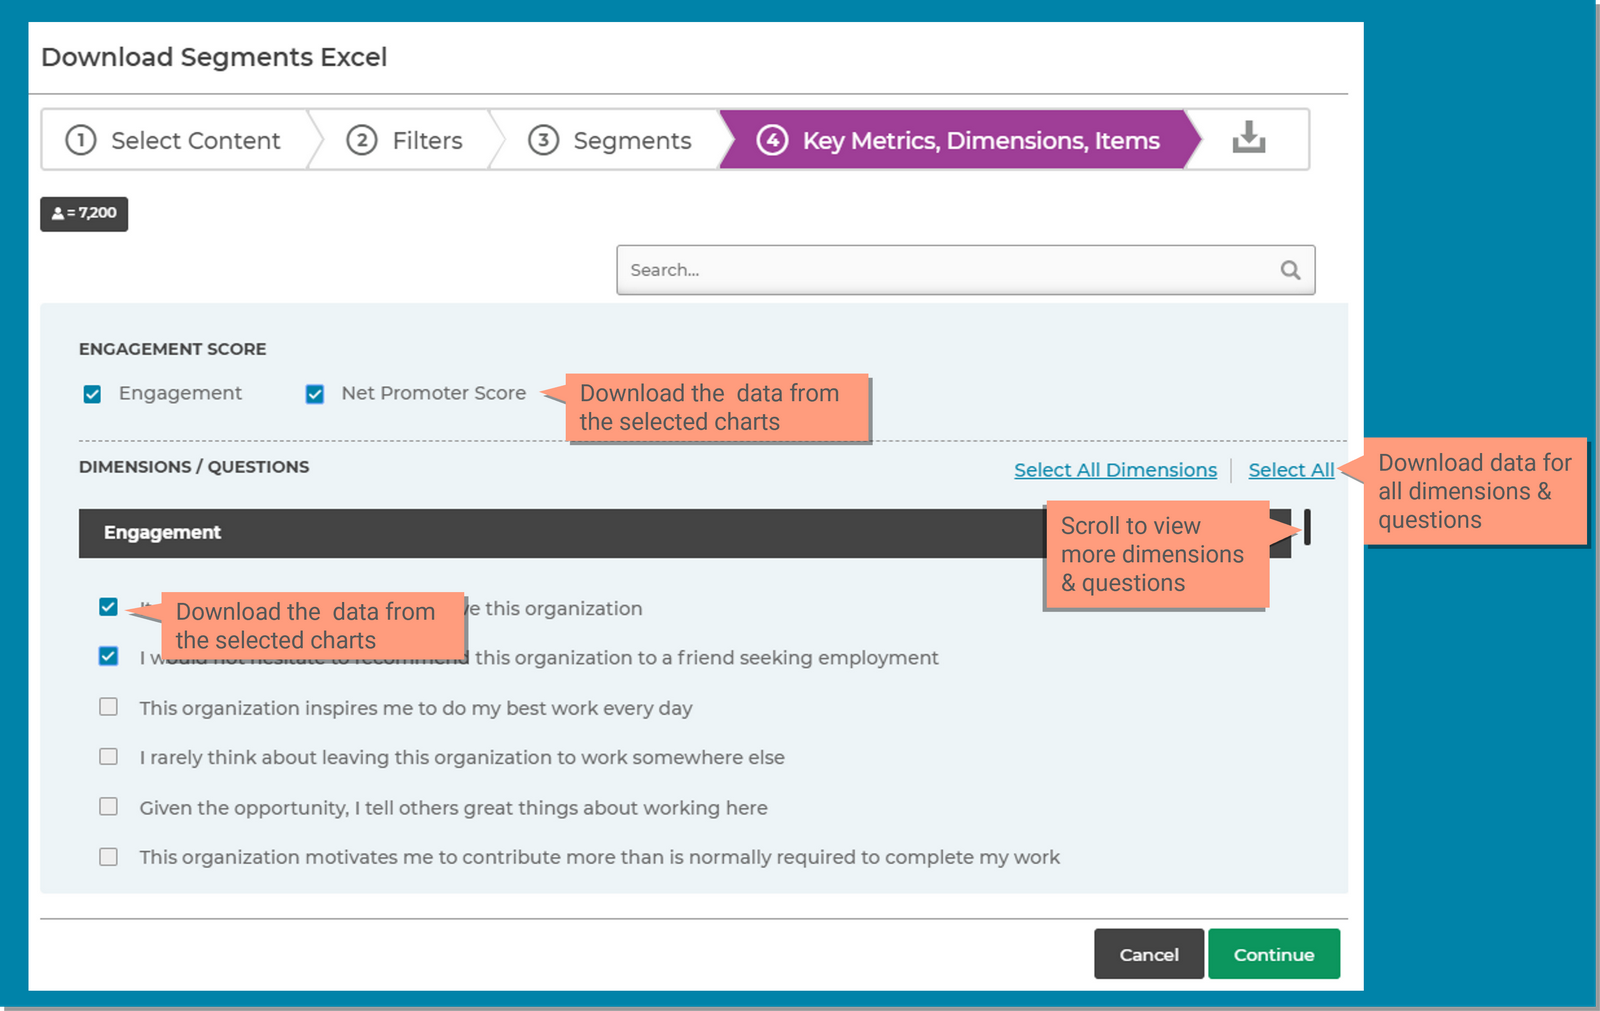
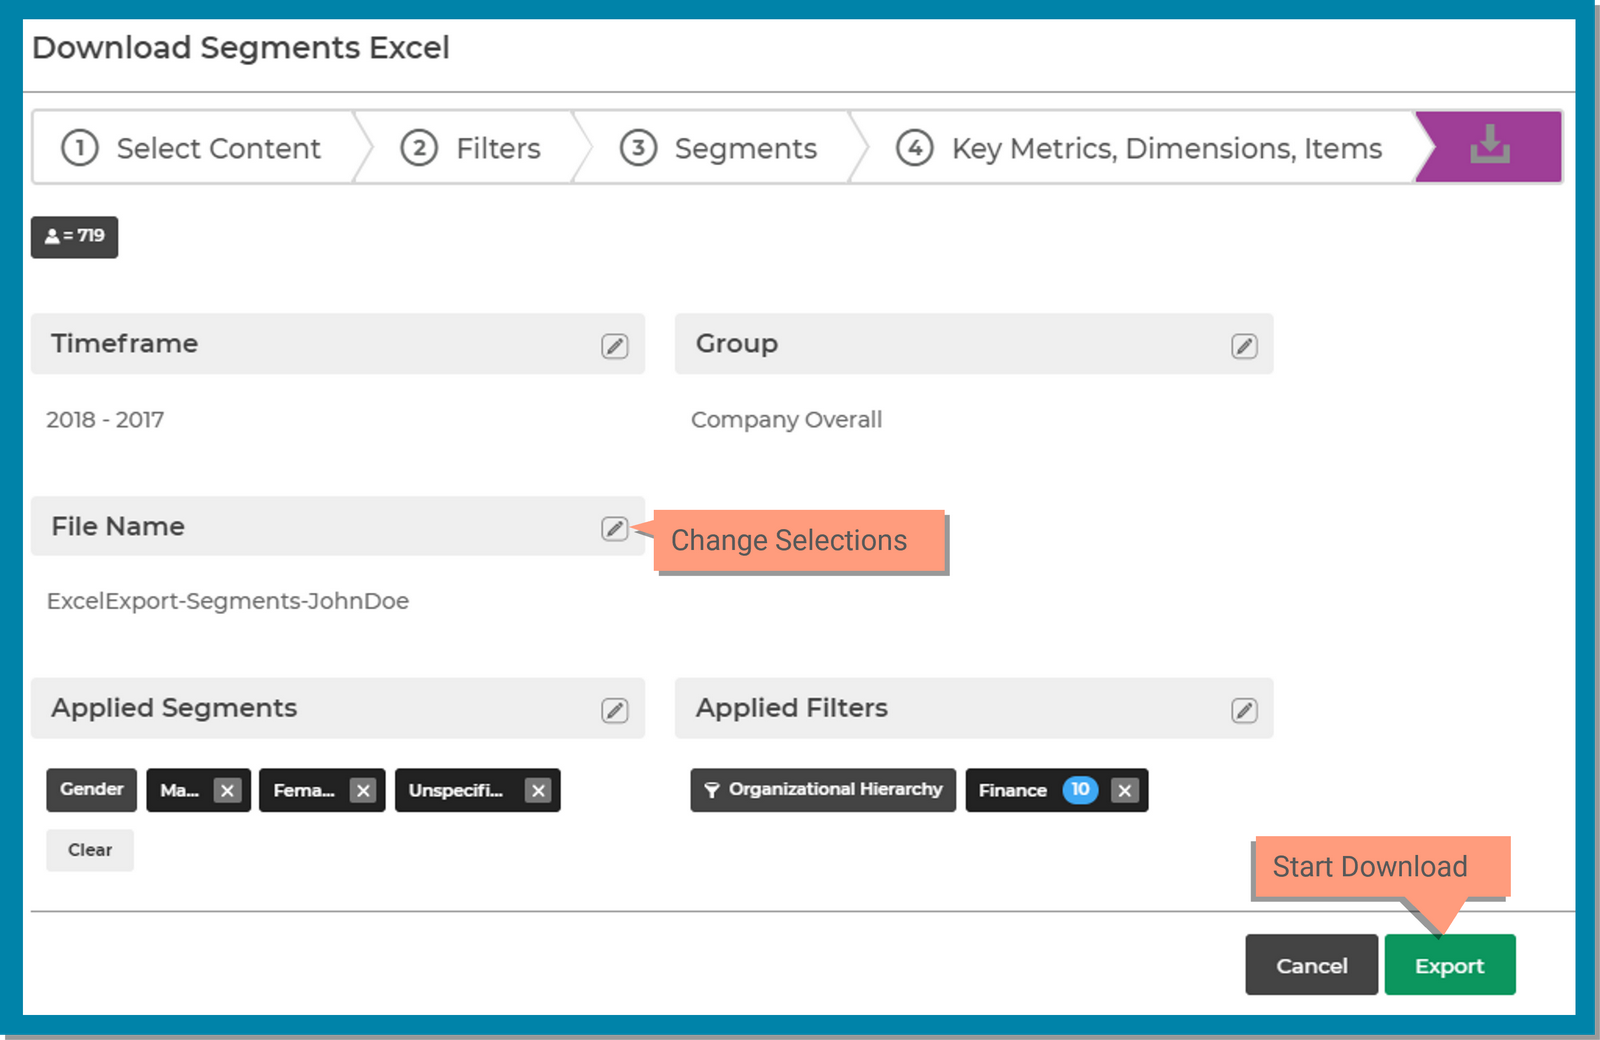
Download Segments Excel will have two sections unique to the Segments page: 3) Segments and 4) Key Metrics, Dimensions, Items


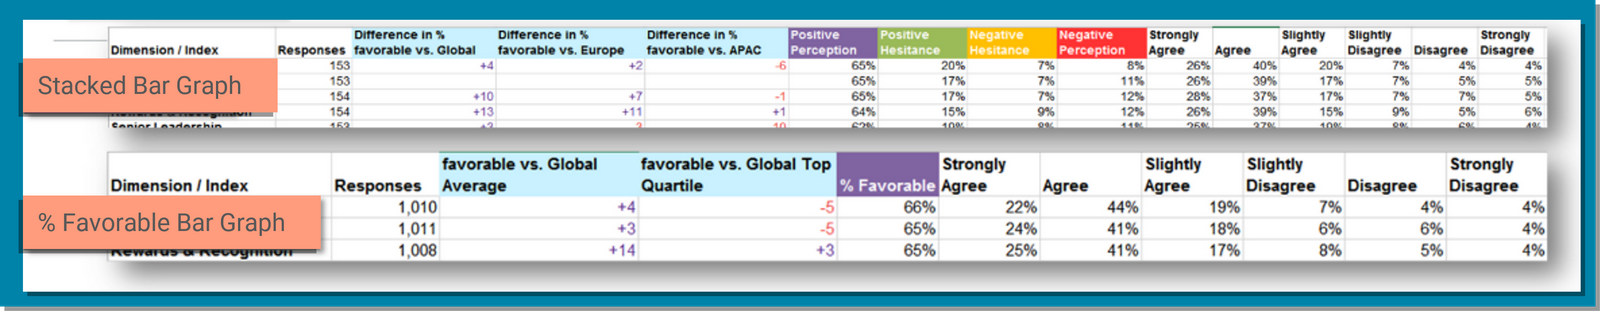
This section allows you to select what chart data you want included in the report.
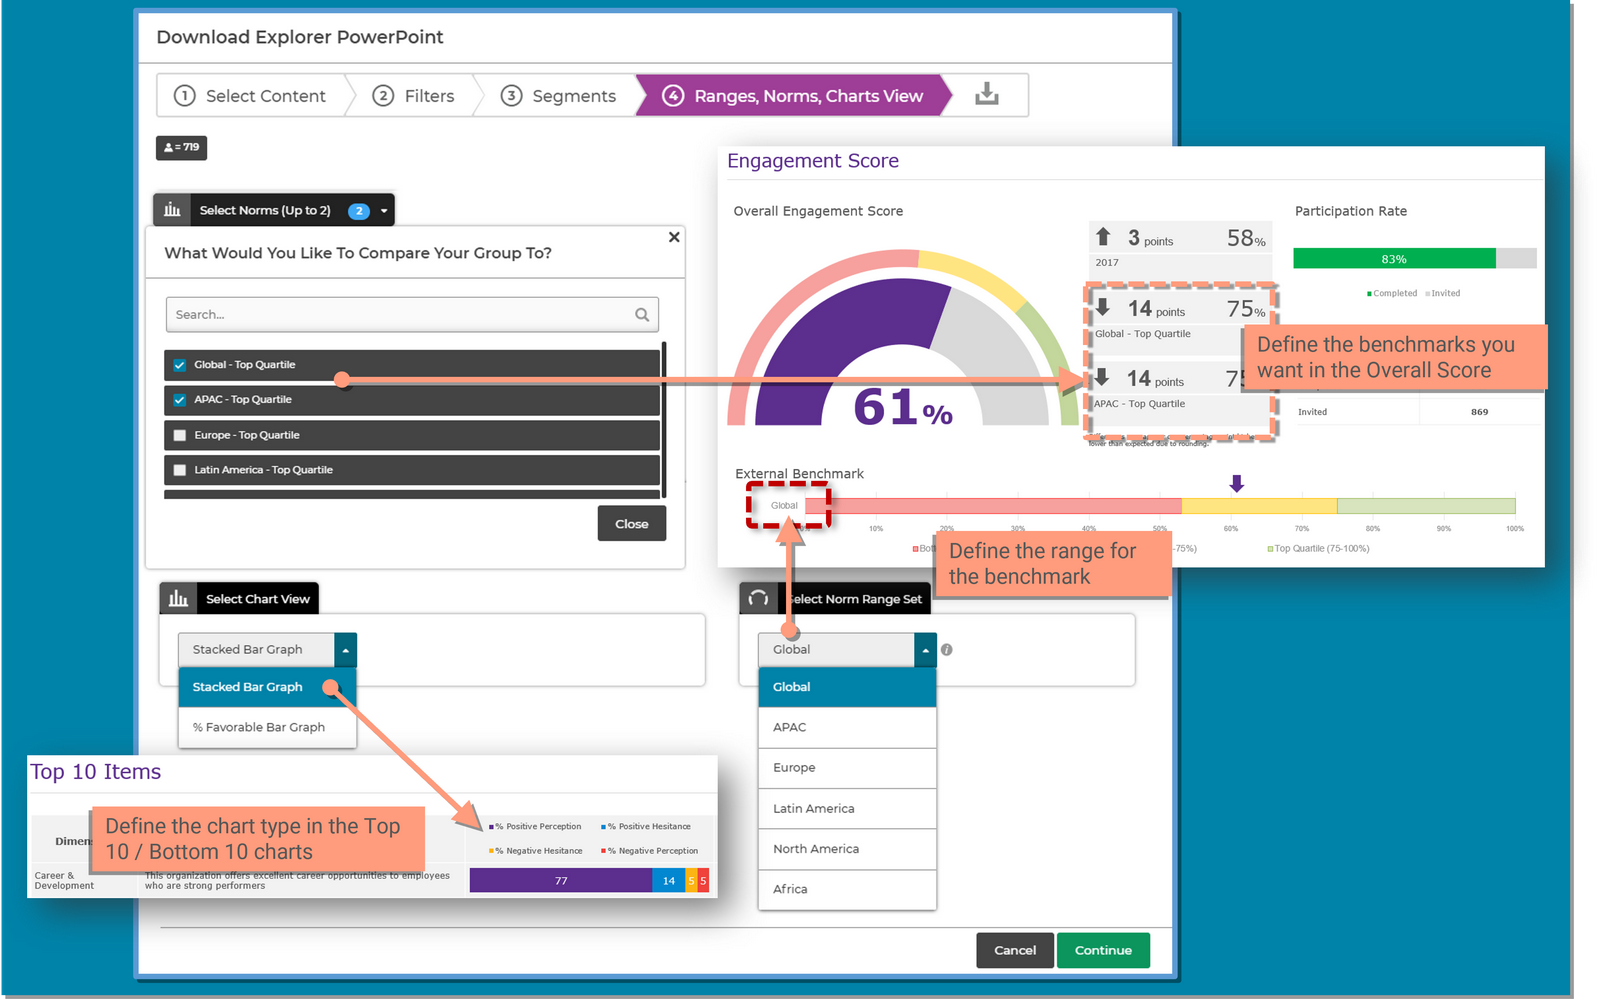
When downloading PowerPoint using custom options, the menu will have two sections specific to the export: Segments and Ranges, Norms, Charts View

This section allows you to select what chart data you want included in the report.