Explorer Learn allows you to compare your survey results to other groups within your company and external benchmarks.
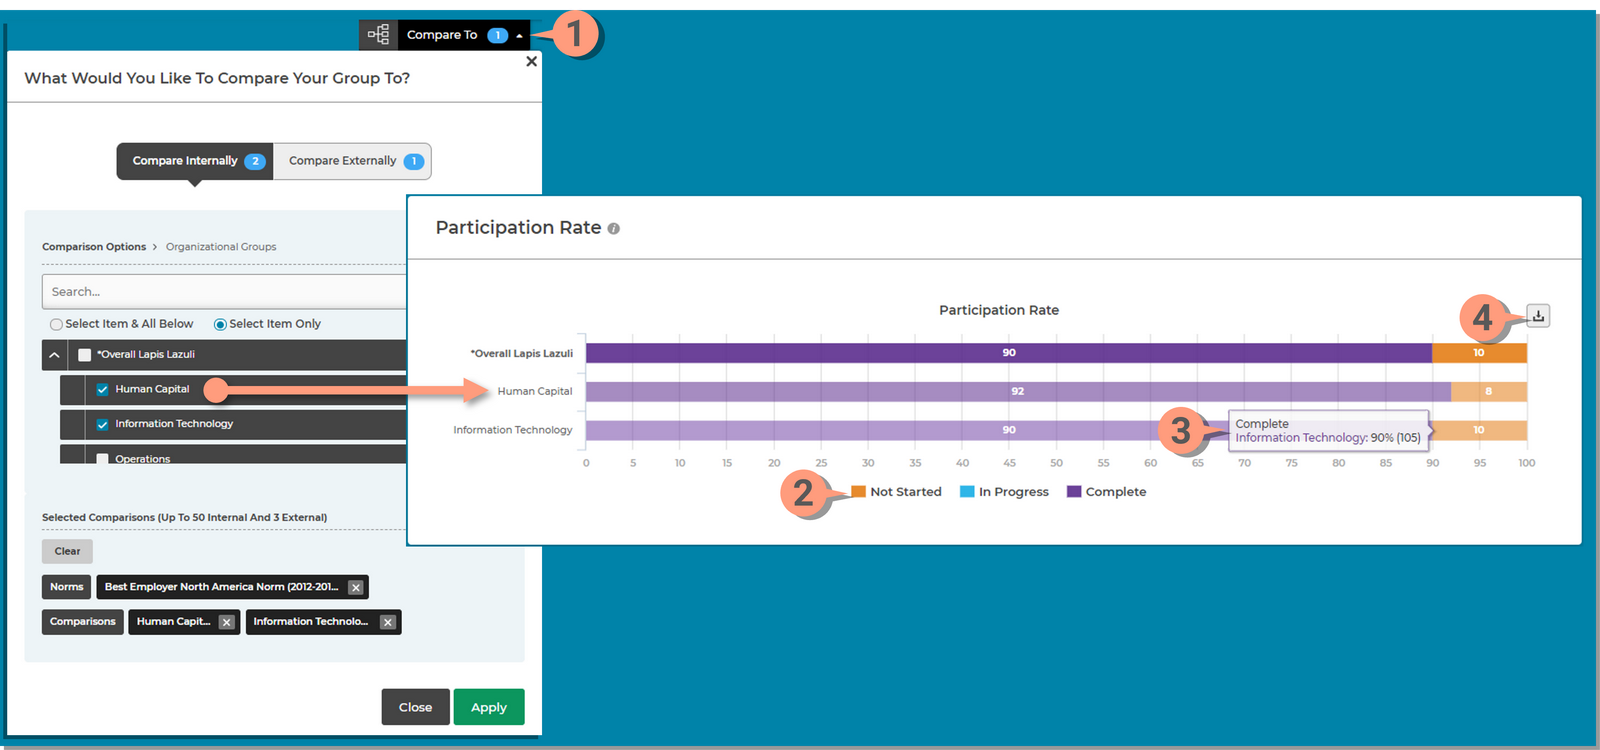
The Learn page provides multiple tools you can use to make selections or show/hide details. Here are some screenshots of each tool to help you navigate the instructions below.
Explore the different sections of the Learn page.
Depending on your company requirements, you may not have access to all sections.
The Dimension Summary section displays select dimensions that are important to your organization. This section may not be applicable on your site.
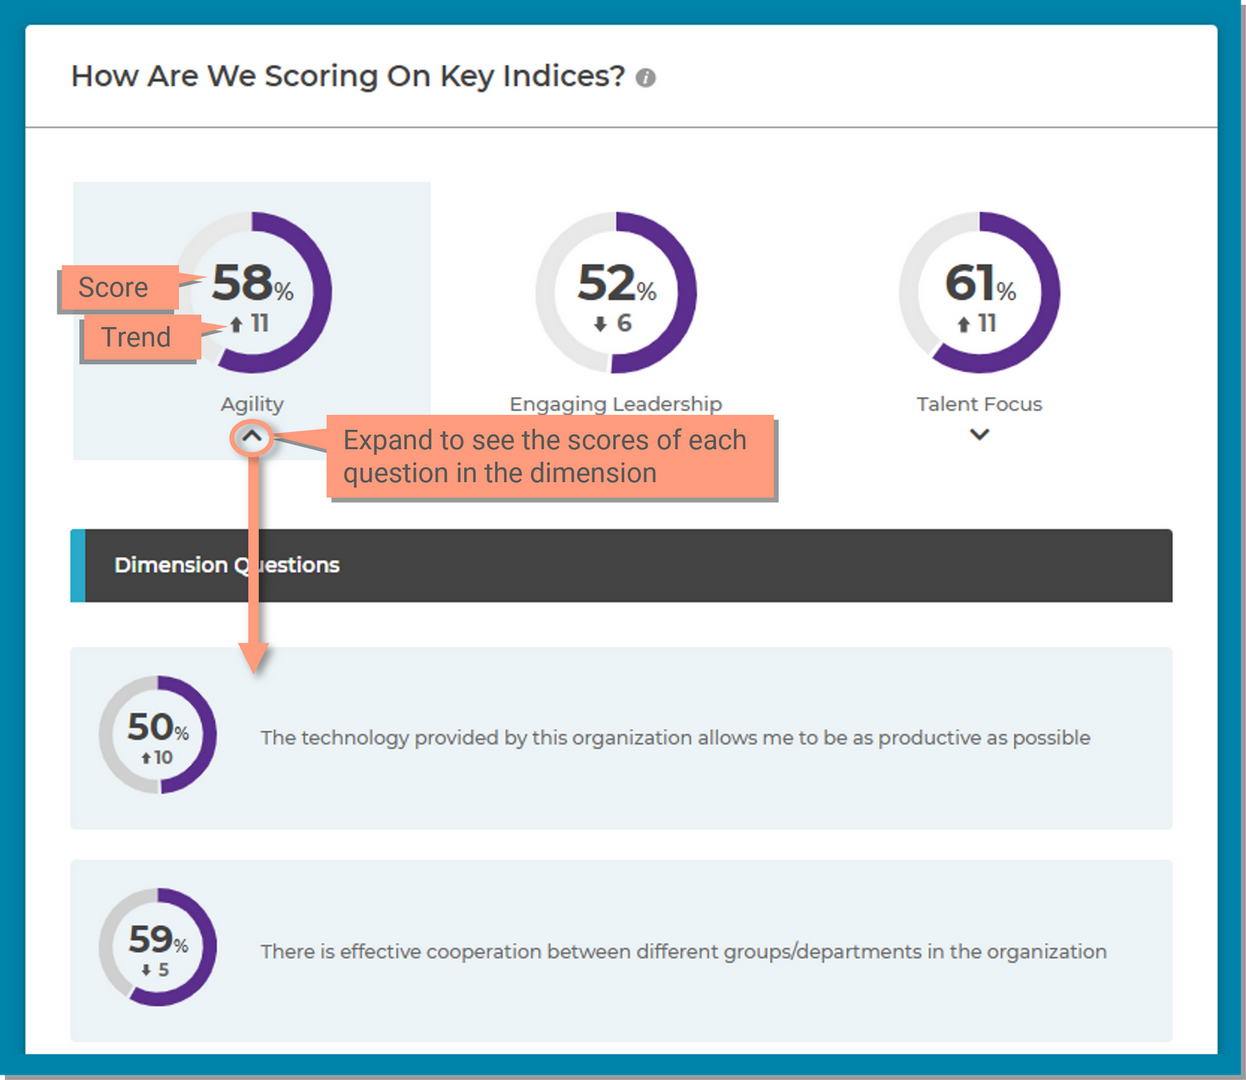
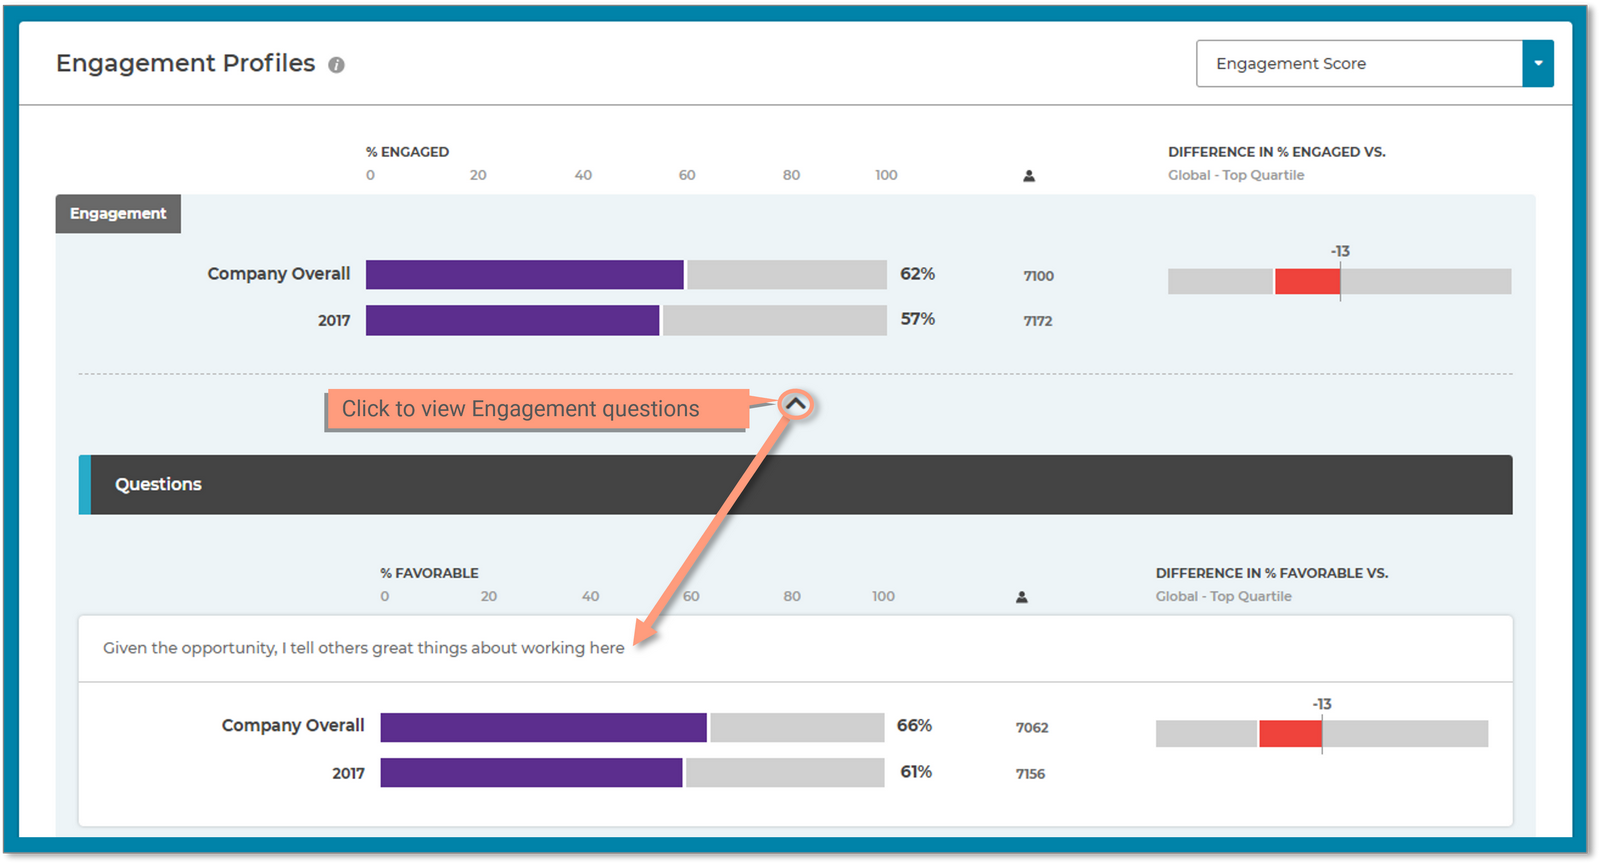
The Score section allows you to view the score and items (questions) for your group and any selected comparison groups. This information contained in this section is determined by the reporting application you are viewing;
Use the Compare To tool at the top of the page to select other groups in your organization or additional benchmarks to the table.
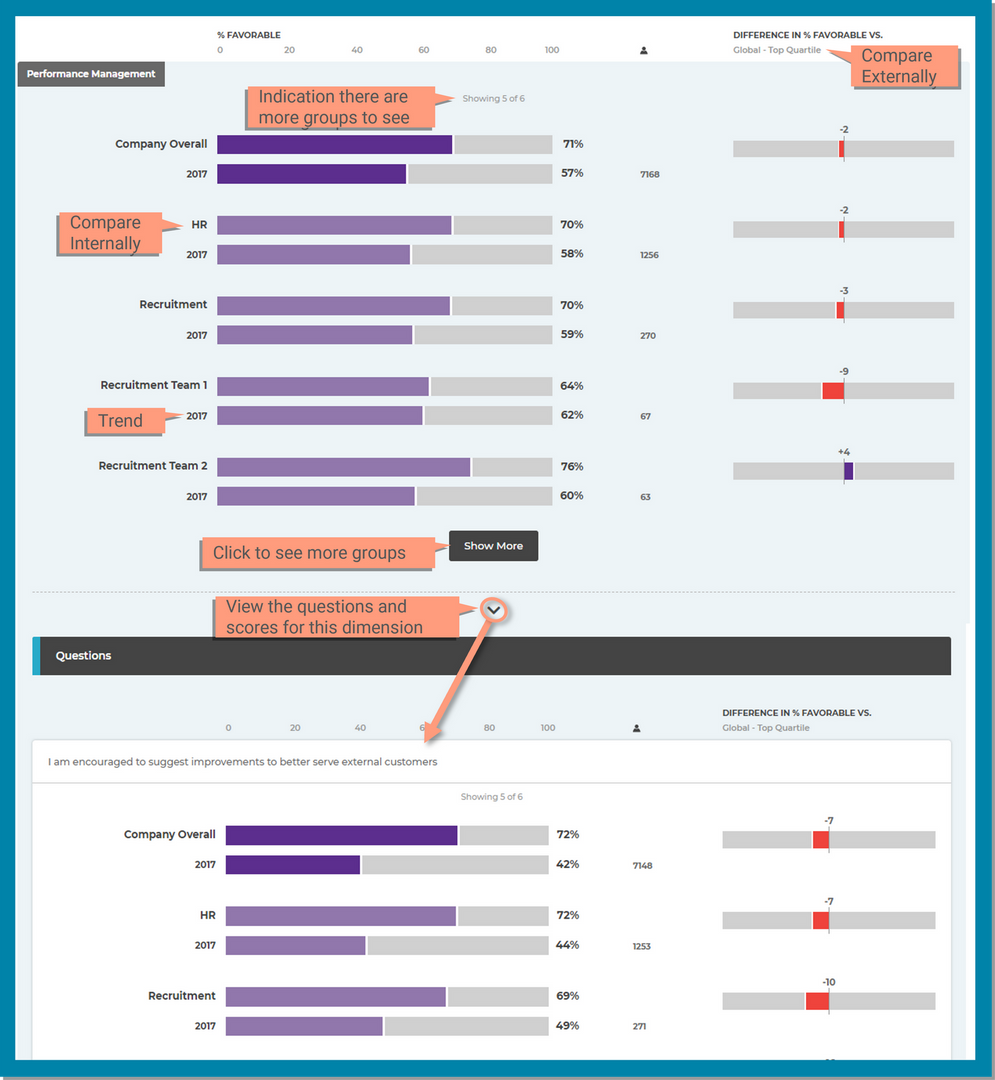
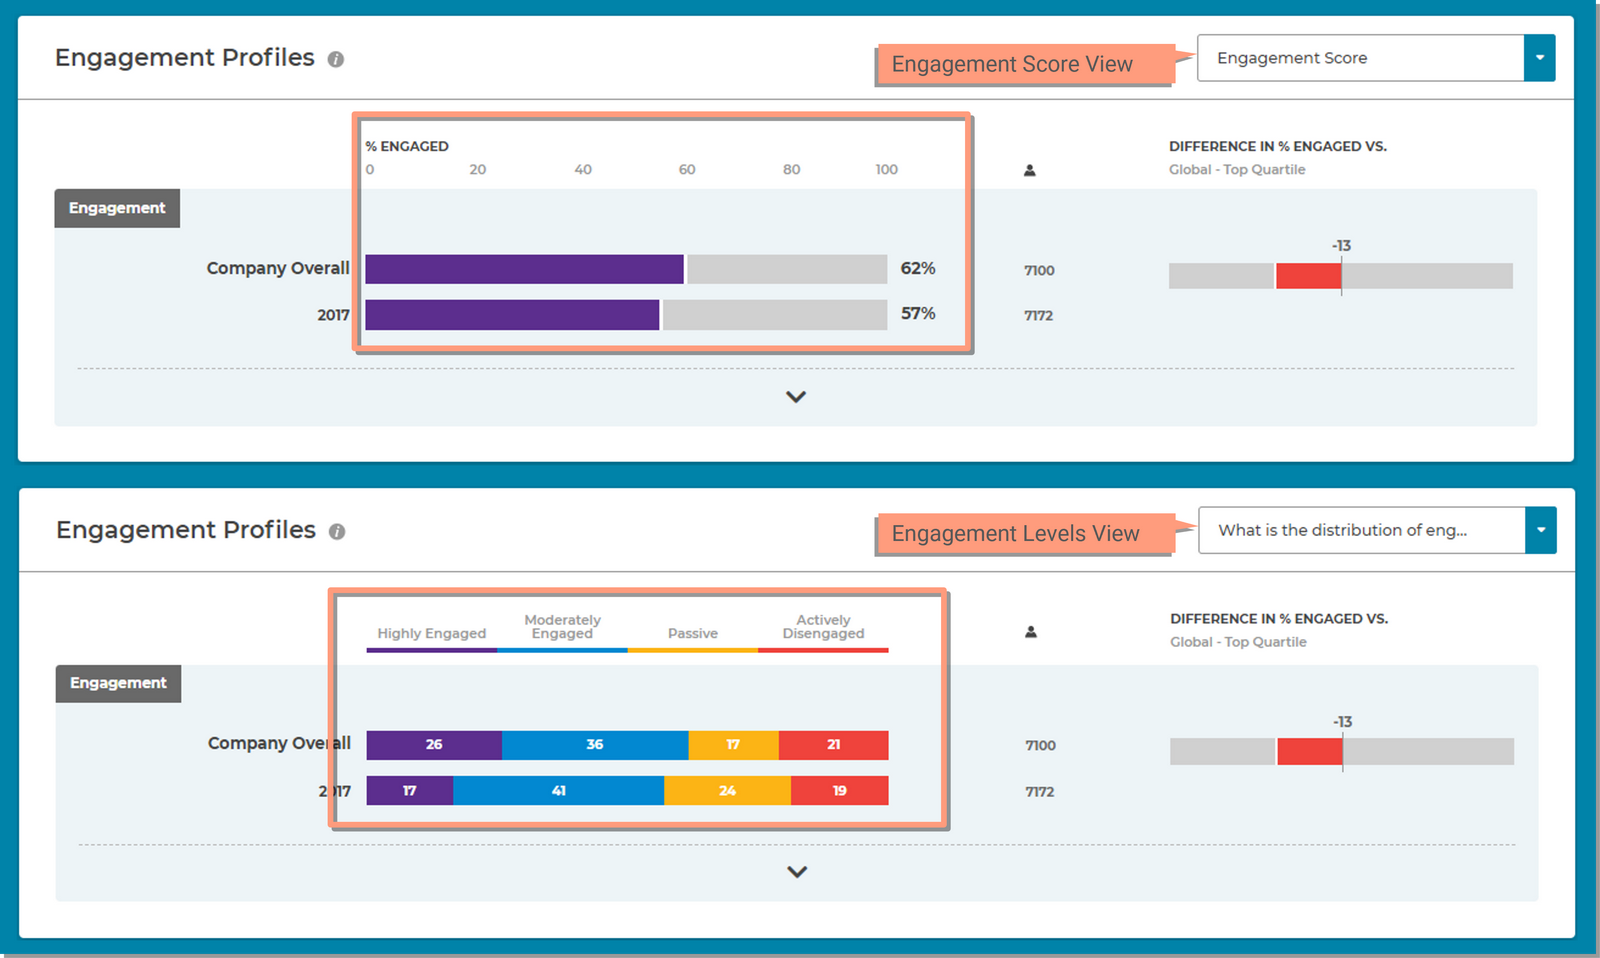
This section displays all of the dimensions in the survey and is sorted according to percent favorable. Similar to the Score section, it allows you to add groups and benchmarks using the Compare To filter.
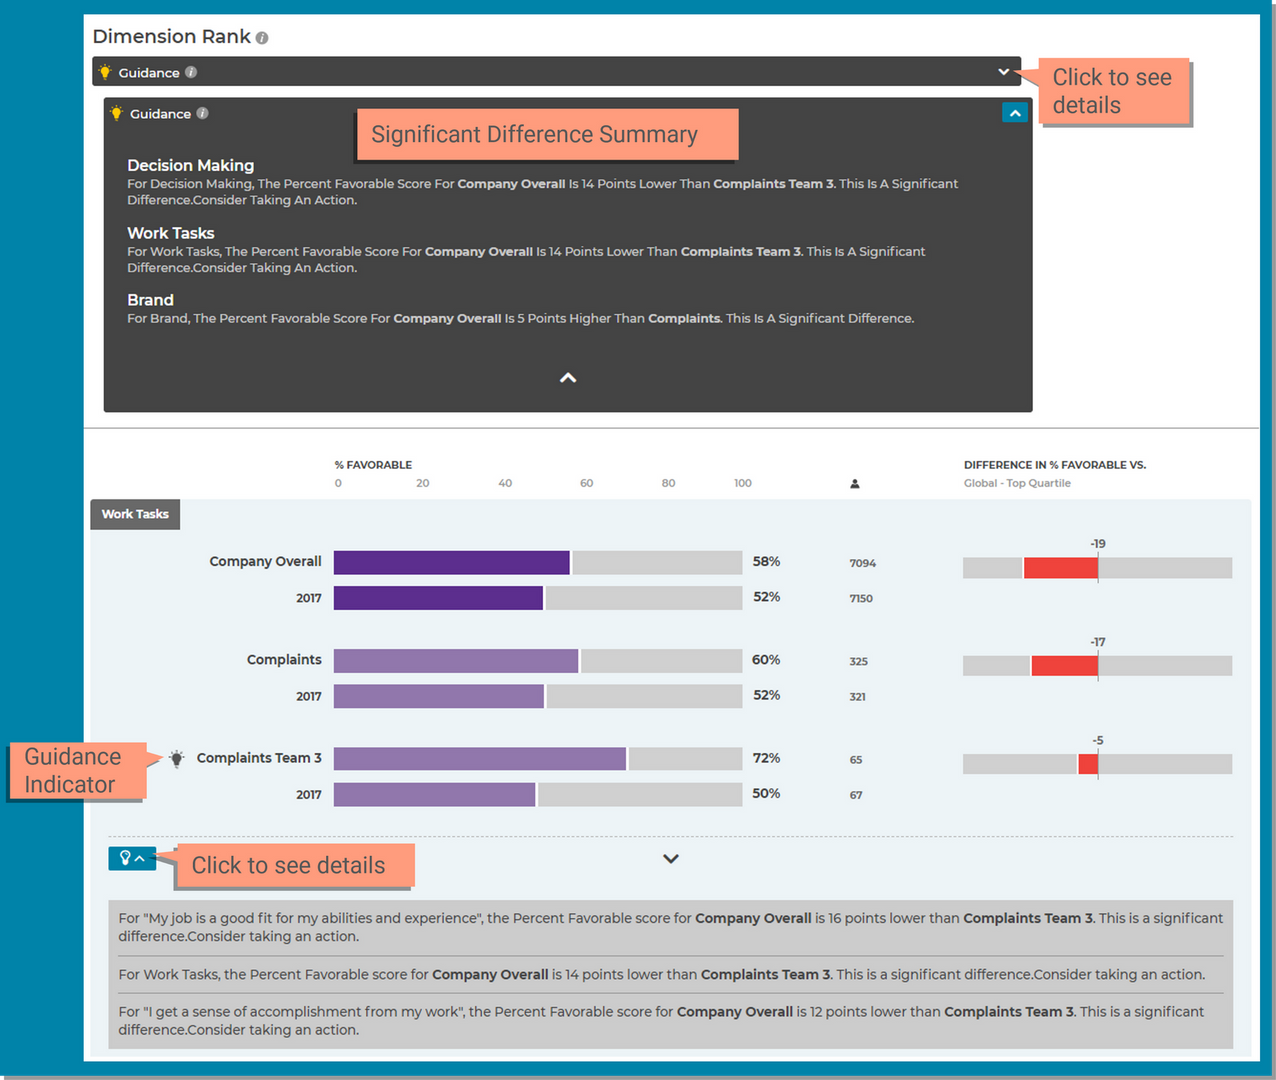
This section also has the Significant Differences section which will appear in multiple places.
These are areas where your group shows significant positive or negative differences versus the other groups. Pay attention to these gaps - they likely represent strengths or opportunities.
Significant Difference uses the following measurements:
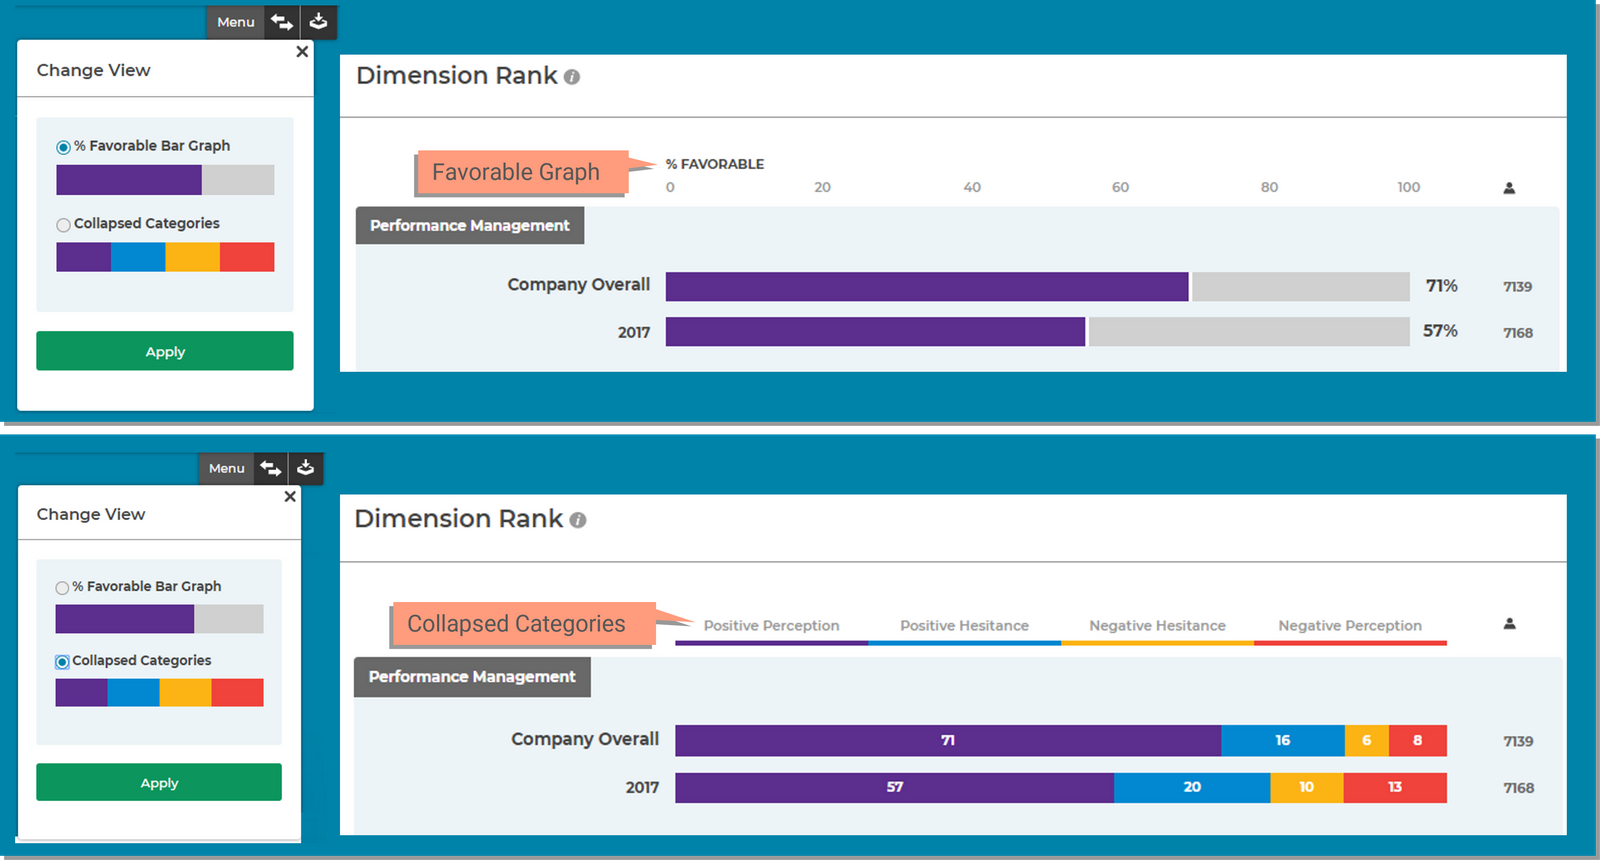
Some users may have the Change View selector within the Menu tool at the top right of the screen. This will allow you to change the view from the default of % Favorable Bar Graph to a Collapsed Categories Graph. The collapsed categories graph combines response data into groups.
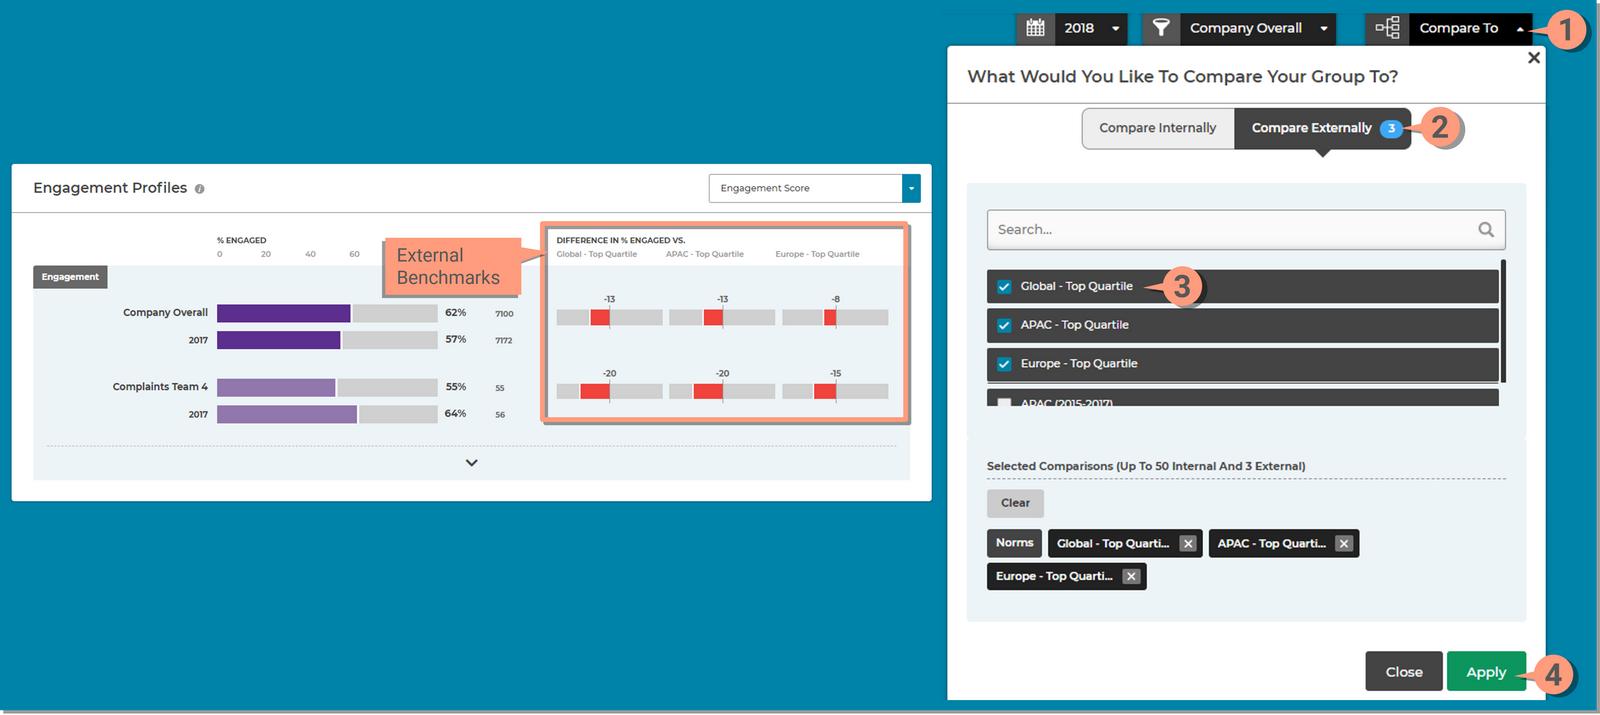
Use the Compare To tool at the top of the page to select additional norms to the table to compare your results to other normative data by displaying the difference in percent favorable to the norm.
Use Compare Externally to add more benchmarks.
This section will appear when you have Other Questions presented on the survey that are not linked to dimensions. It functions exactly like the Dimension Rank section and will always appear on the page after the Dimension Rank sections when applicable.

The Participation Rate Chart represents the status of survey responses for all the people invited to participate in the survey. Here are some of the features of the participation rate chart;
