Filtering & Comparing

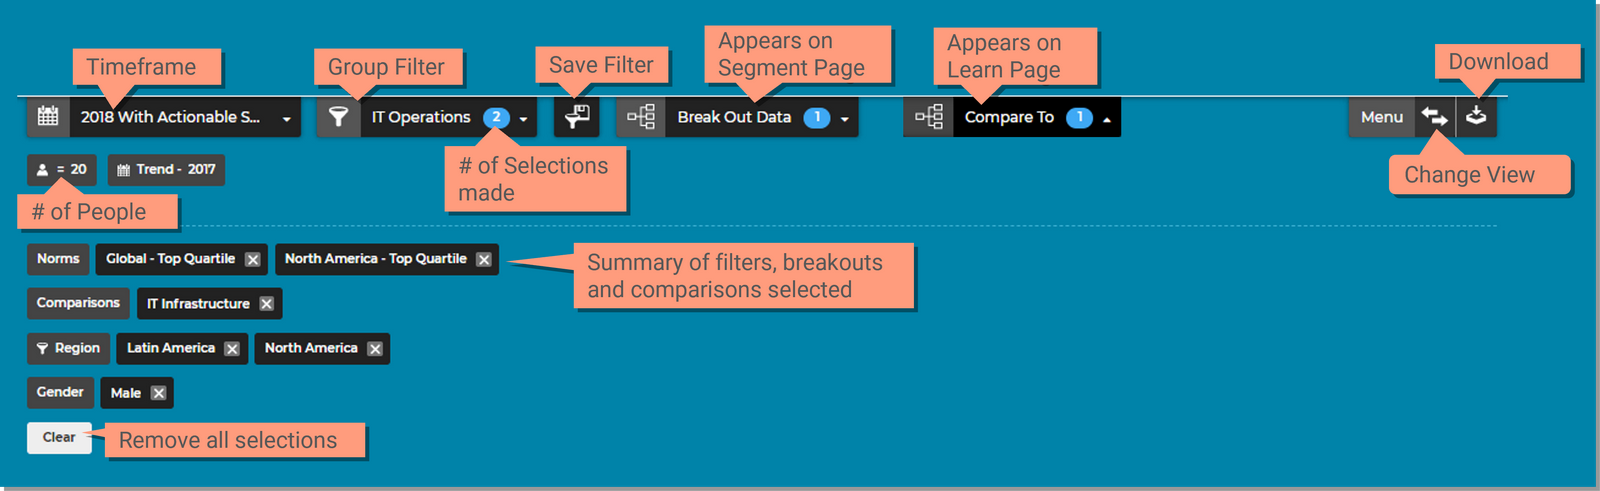
At the top of each page, you will find selectors that allow you to define what demographic, benchmarks and populations you can use to view and compare your data. These options will vary depending on which page you are viewing: Dashboard, Learn, Segment or Listen.


Before you begin...

  • Understanding how to use these selectors will help you explore your results in a meaningful way. Watch the video overview for a quick tutorial.
   VIDEO OVERVIEW

Timeframe Selector


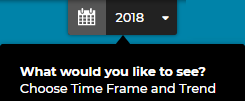
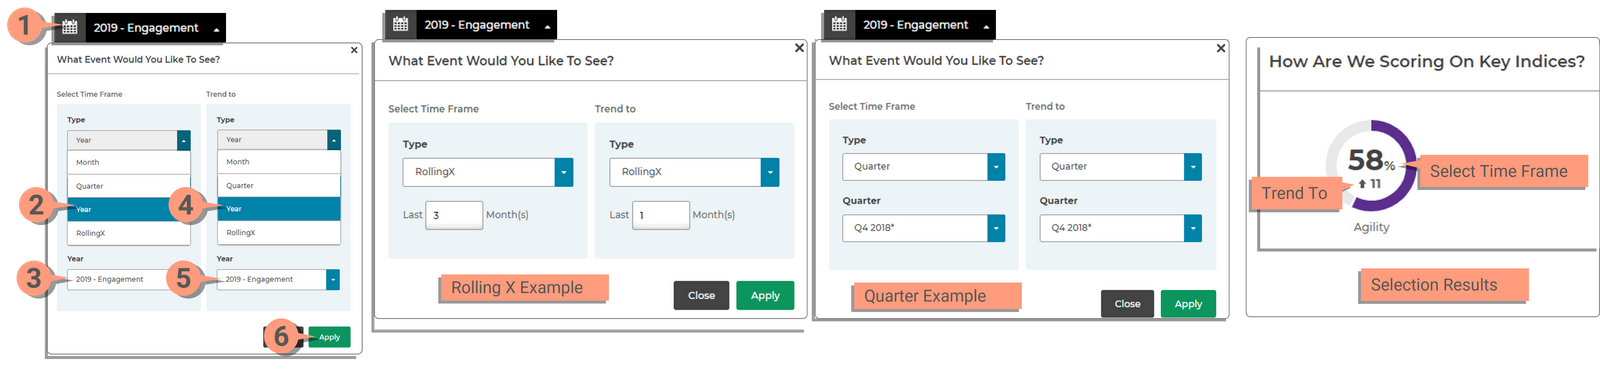
The Timeframe selector appears on all of the pages and allows you to select the focal timeframe and if applicable, the trend timeframe.

  • Selecting a Time Frame and a Trend To will allow you to see how you are trending over time.
  • You may have all or just some of the selection options shown below:
    • Year: Compare your results from one year to another. This is the most common selection option.
    • Month: If your company does monthly pulsing, this option would be available and allow you to select specific months of the year.
    • Quarter: If your company does quarterly pulsing, this option will allow you to compare quarters: Q1, Q2, Q3 or Q4.
    • Rolling X: If you have Monthly or Quarterly options available, this will allow you to select a specific number of months that you can define such as view the last 2 months.

To change timeframe of your results:

  1. Click on the Calendar icon.
  2. Select the 'Select Time Frame' Type (year, month, quarter or rolling X)
    • In most cases Year will be your only selection unless your company participates in monthly or quarterly pulsing. This is the time frame that the 'Trend To' time frame will compare against everywhere.
  3. Select the Survey 
  4. Select the 'Trend to' Type
  5. Select the Survey
  6. Click Apply
    • When using the Time frame selector, any selections made in other filtering tools will be cleared out. It is advised that you select the desired Time Frame before making any other filtering selections


Dimensions & Questions

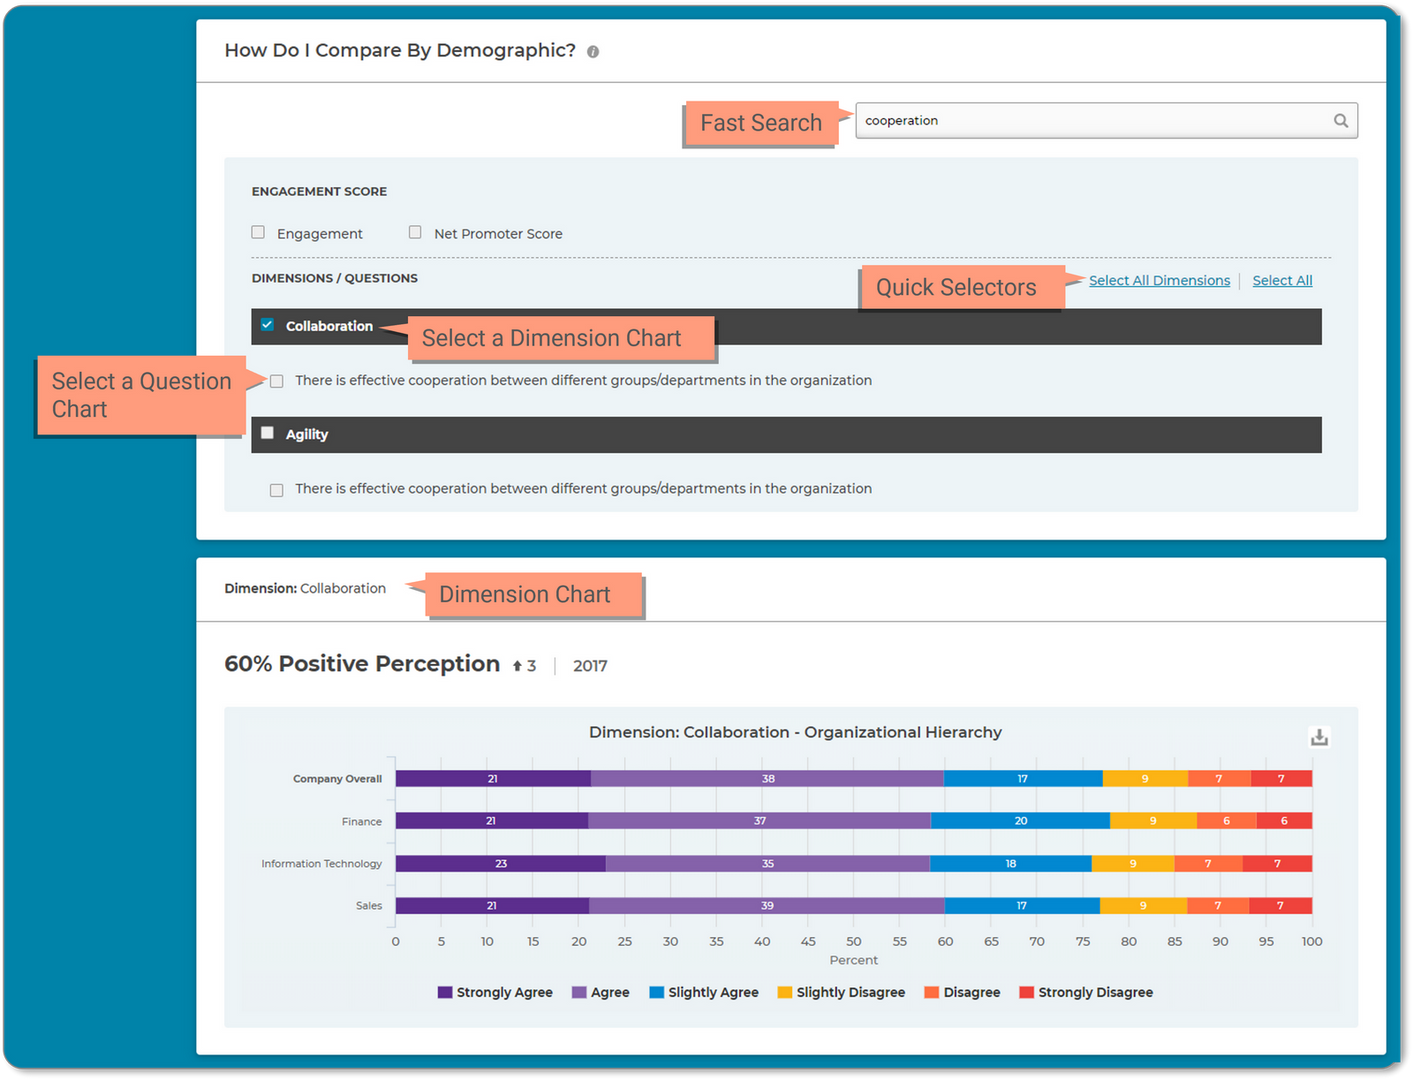
This section displays all the questions on the survey grouped into dimensions. There are several options for selecting charts:

  1. Search: Allows you to search for specific text
  2. Check Dimensions and Questions individually by clicking the box next to the desired item.
  3. Select All Dimensions: Selects and displays all the charts for Dimensions.
    • When this option is selected, a 'Deselect All Dimensions' option will appear allowing you to automatically clear the selections.
  4. Select All: Selects and displays charts for all of the Dimensions and Questions in the list.
    • When this option is selected, a 'Deselect All' option will appear allowing you to automatically clear the selections.


Understanding Trend

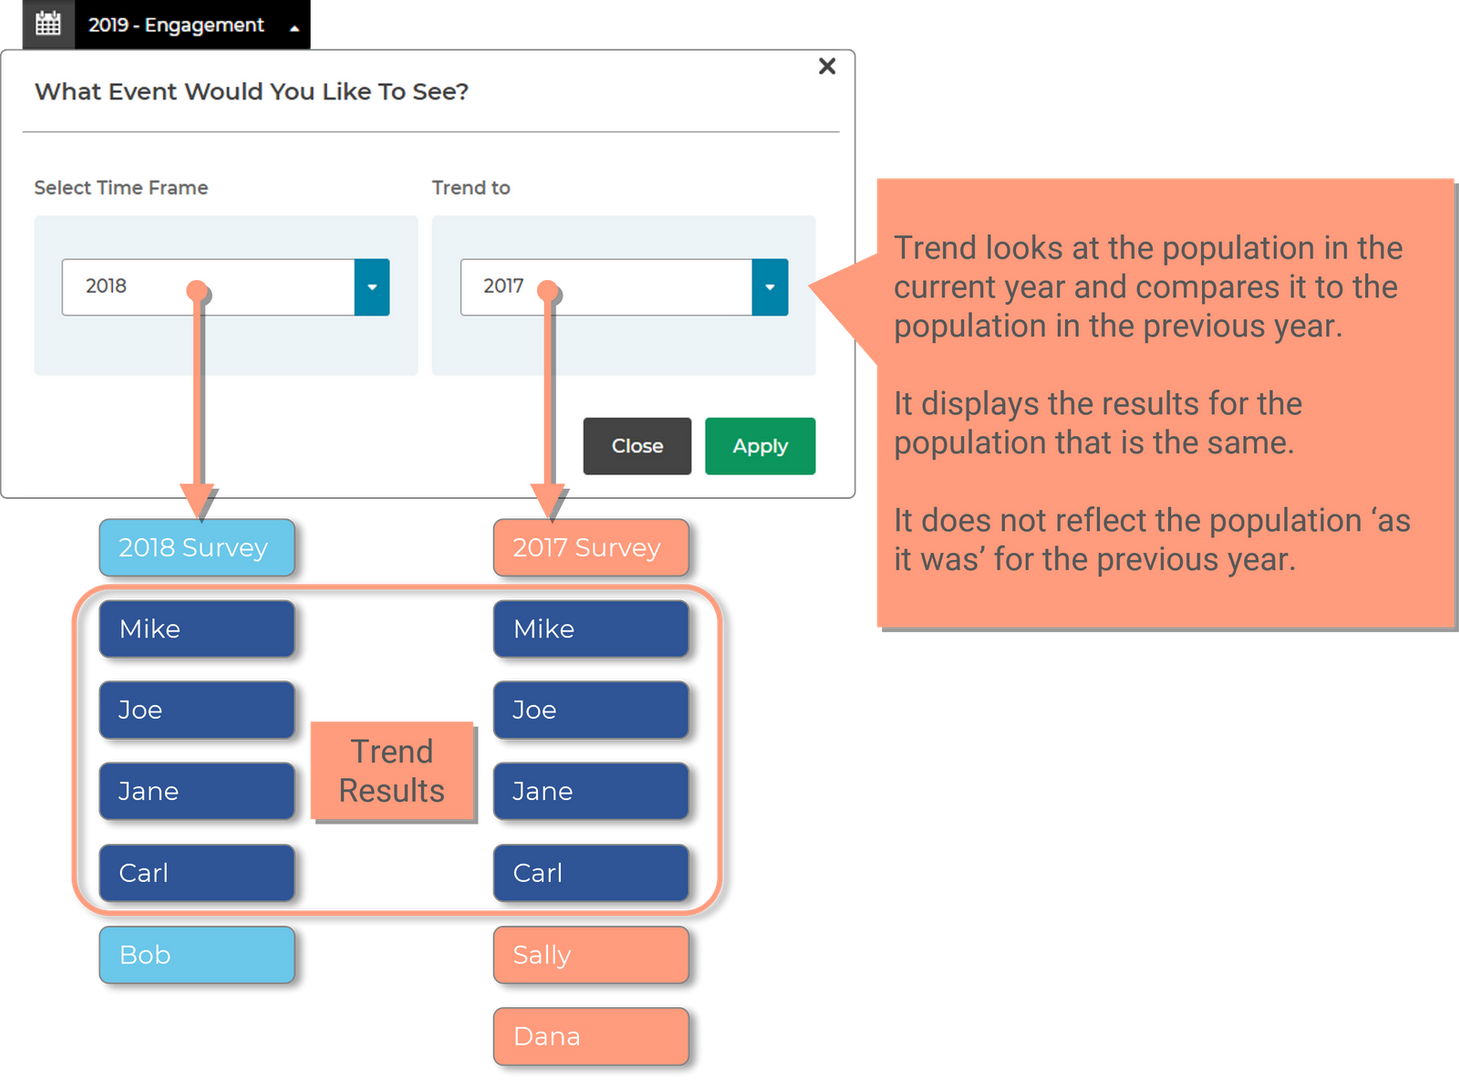
Trend to is the historical survey, charts will display how the scores are trending compared to the group chosen in the Filter Selector tool. 

Trend Population: It can be confusing to understand what you're looking at when viewing trend in the Dashboard, Learn or Segment. Its important to understand that the organization structure (or population) in the trend is the same population selected in the Time Frame sector.

Chart Options - Filtering the Group

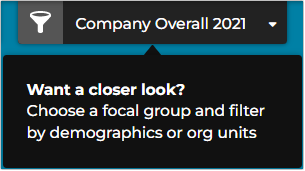
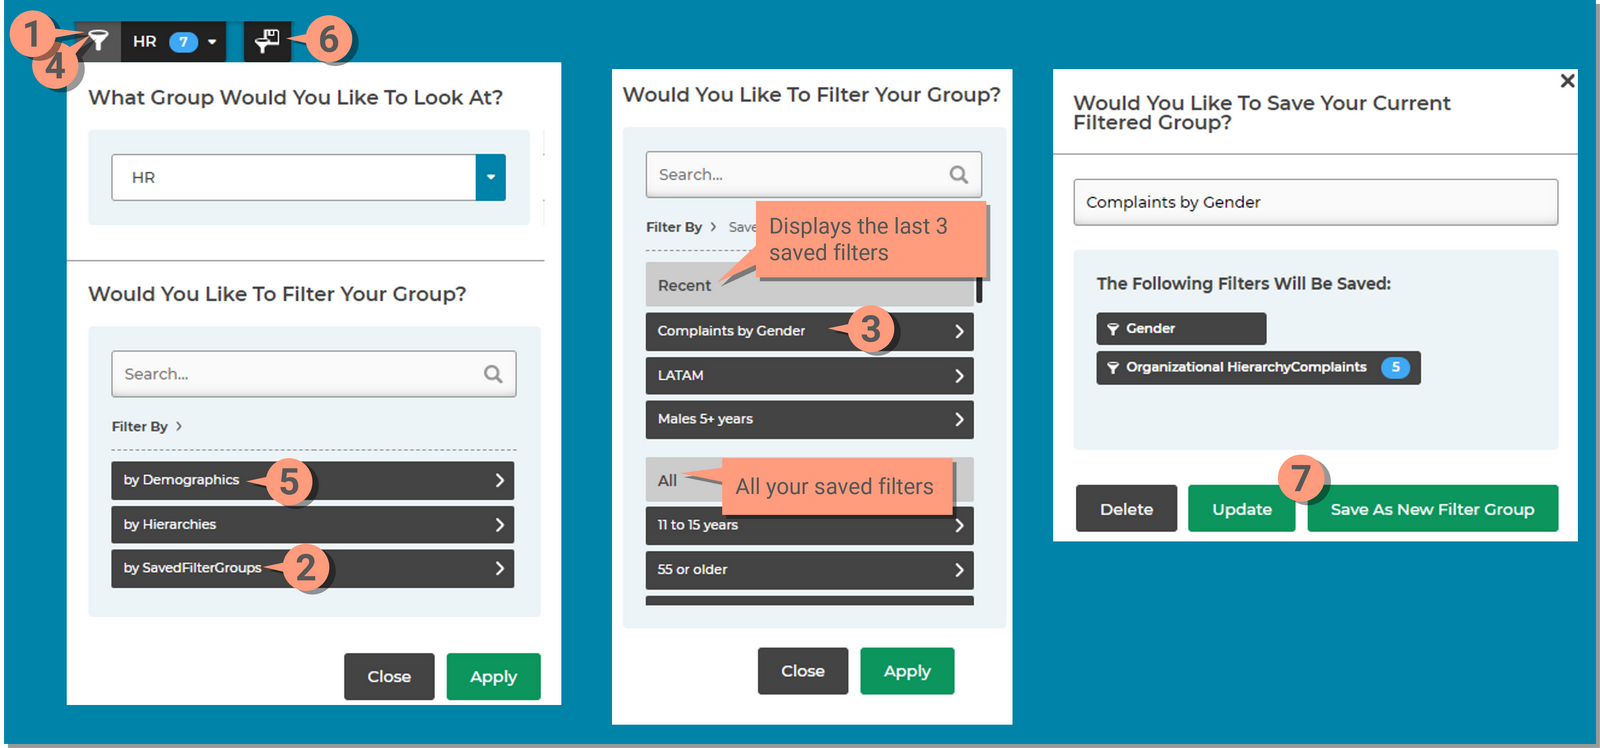
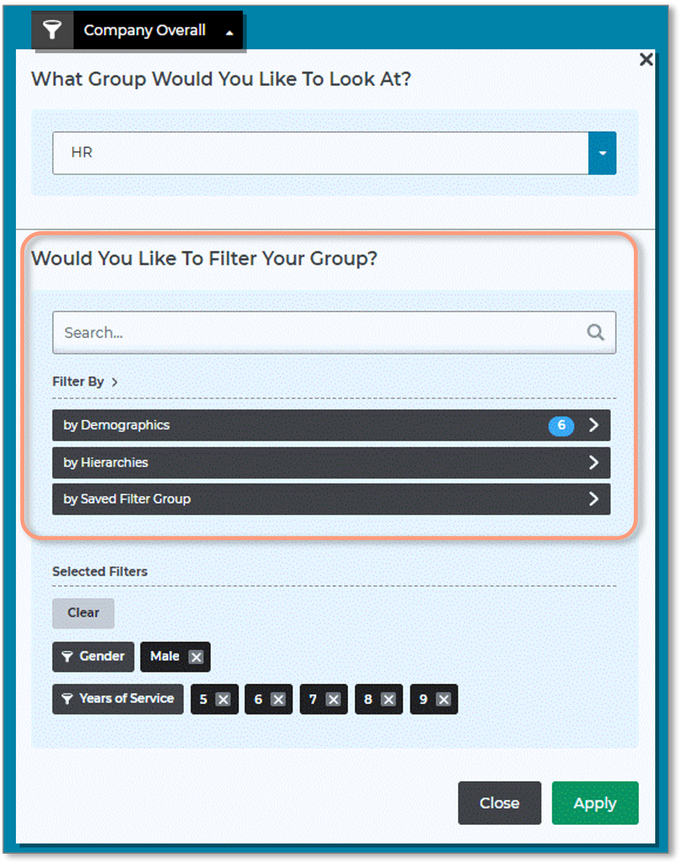
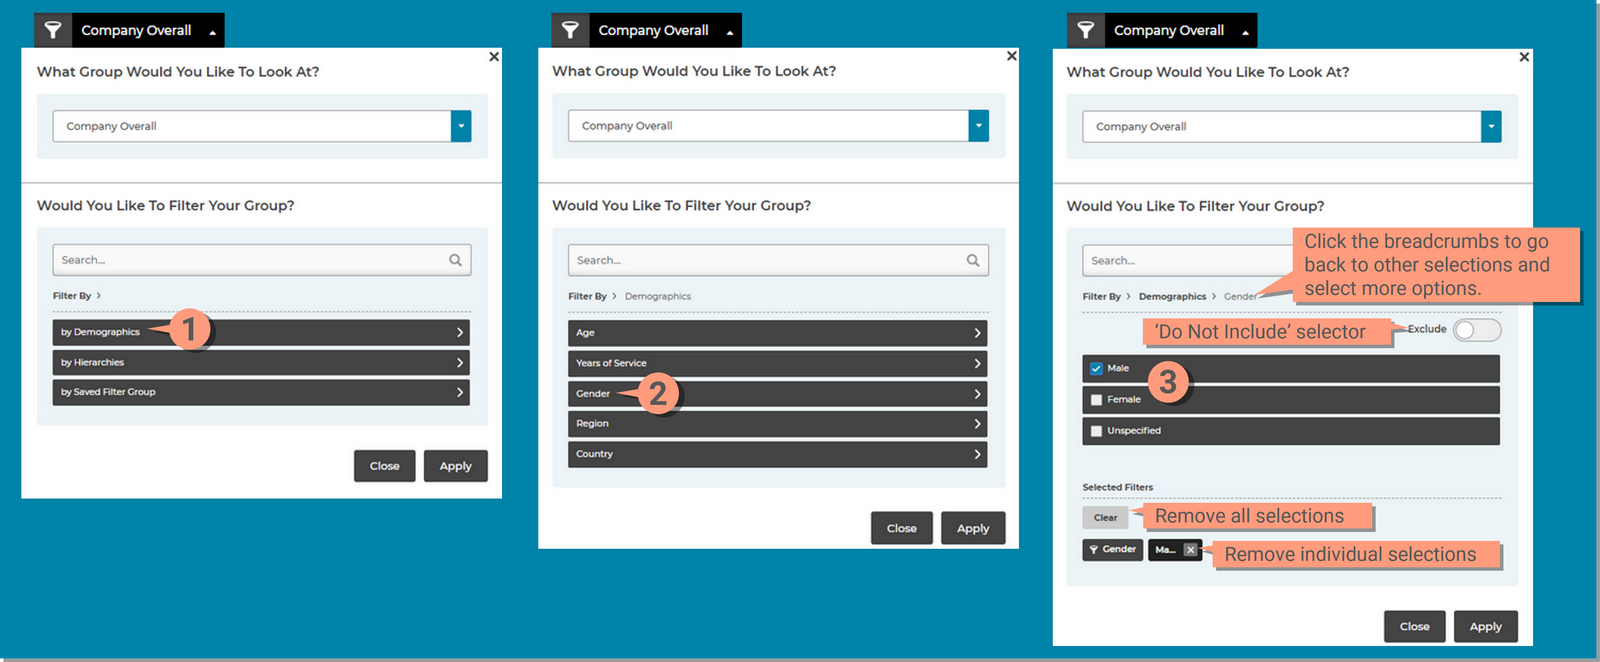
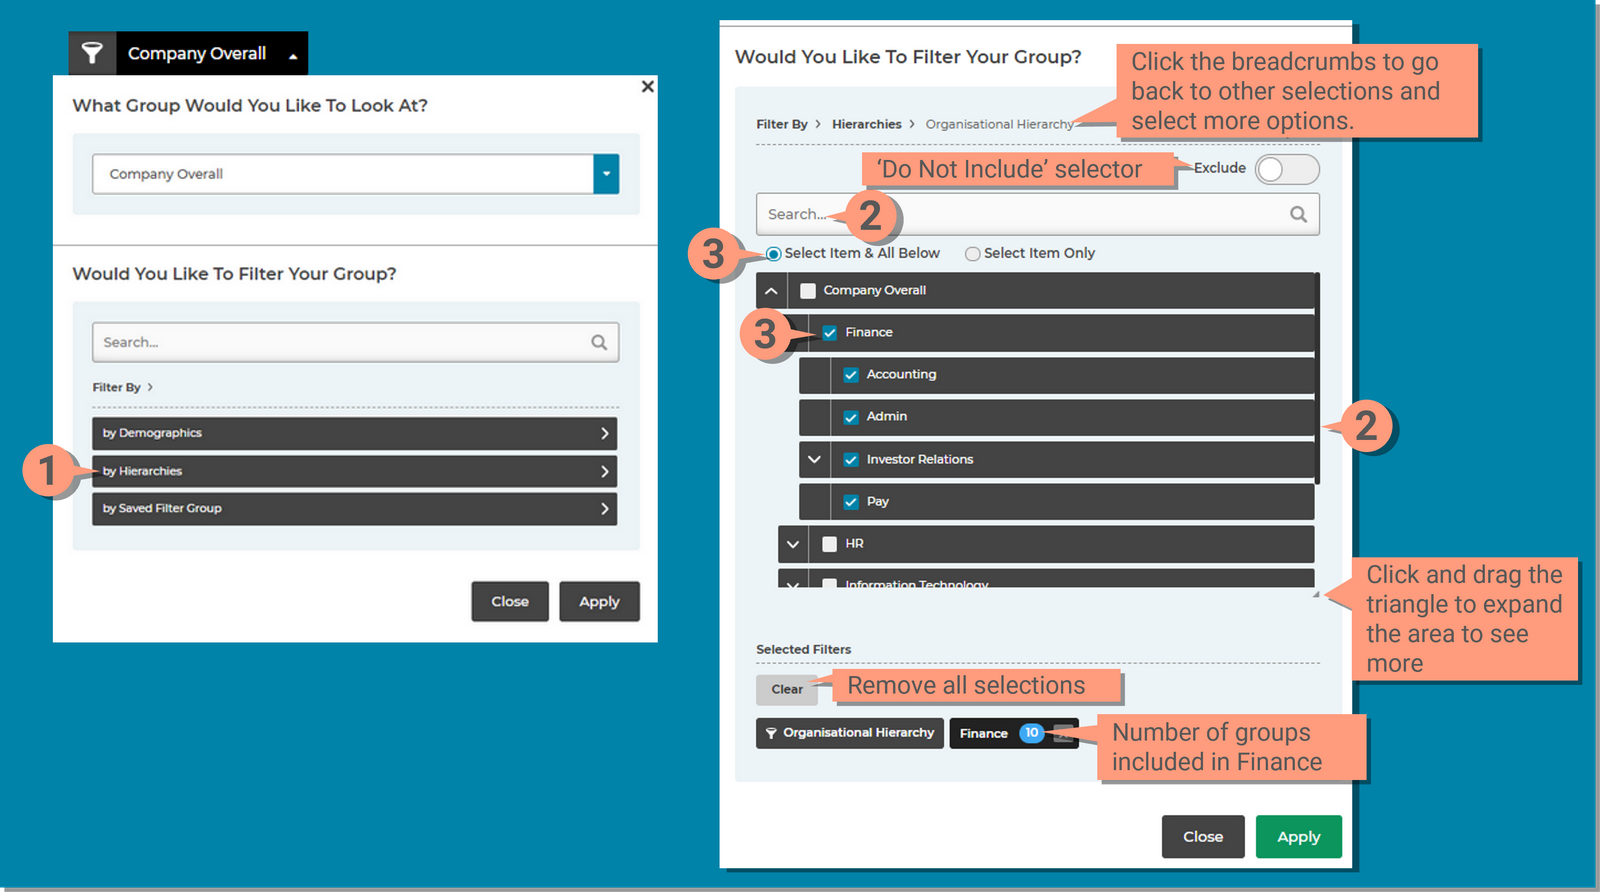
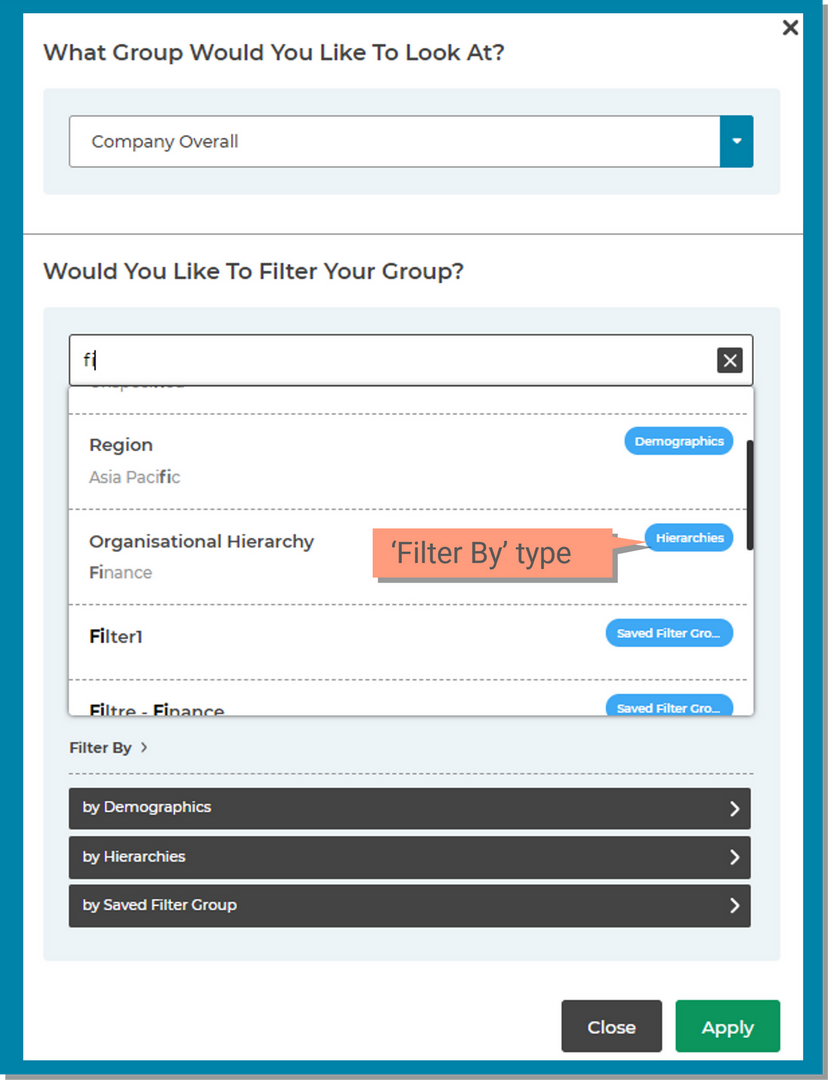
Use the Filter selector to change the data to focus on a different group. The filter options available to you are determined by your administrator, you may see other options or limited options that are different than the examples below.

You will have multiple options in this selector to filter by:

  • 'What Group Would You Like to Look At?' Selector: Select the organization you want to view the results for.
  • 'Would You like To Filter Your Group? section in the dropdown
    • By Demographics: The list of demographics available are determined by your administrator so in all cases what you see here may be different that what others see.
    • By Hierarchy: This is your organization, the levels of hierarchy that you have access to are determined by your administrator. In some cases you may see the Overall organization and only your organization with no other groups. This will allow you to compare your group scores against the overall company scores. Depending on your access, you may have the ability to view the entire organization hierarchy.
    • By Saved Filter Groups: This will appear once you have saved a filter group. Access your saved filter groups using this option.

Selecting Filters

  1. Click the Filter menu
  2. Select the Group you want to view using the drop down (if you have more than one option). This may be the full organization structure or only the organizations you belong to.
  3. Using by Demographics
    1. Click the by Demographics button to go to the options
    2. Click the desired attribute (age, gender, tenure)
    3. Check the boxes for the desired demographic (male, female)
      • Use the Exclude button when you want to eliminate that demographic from your results and not include it.
      • Use the Breadcrumbs to navigate back to Demographics or Filter By to add more selections.


Using 'by Hierarchies'

  1. Click the by Hierarchies button
  2. Search or use the scroll bar to find the organization
  3. Select the desired Organization
    • When Select Item & All Below is selected, simply click the top level of the hierarchy and all organizations below will automatically be checked for you.
    • When Select Item Only is selected, only the organizations you click will be selected.
    • Click on the Filter By breadcrumb to return to the main menu if you want to make selections from the Demographics option.

Using Search...

  1. Enter the Search Criteria
  2. Select the Desired Result to navigate to that filter option
    • Use the 'Filter By' type indicator to help determine the correct desired filter.


'Compare To' Selector (Dashboard & Learn)

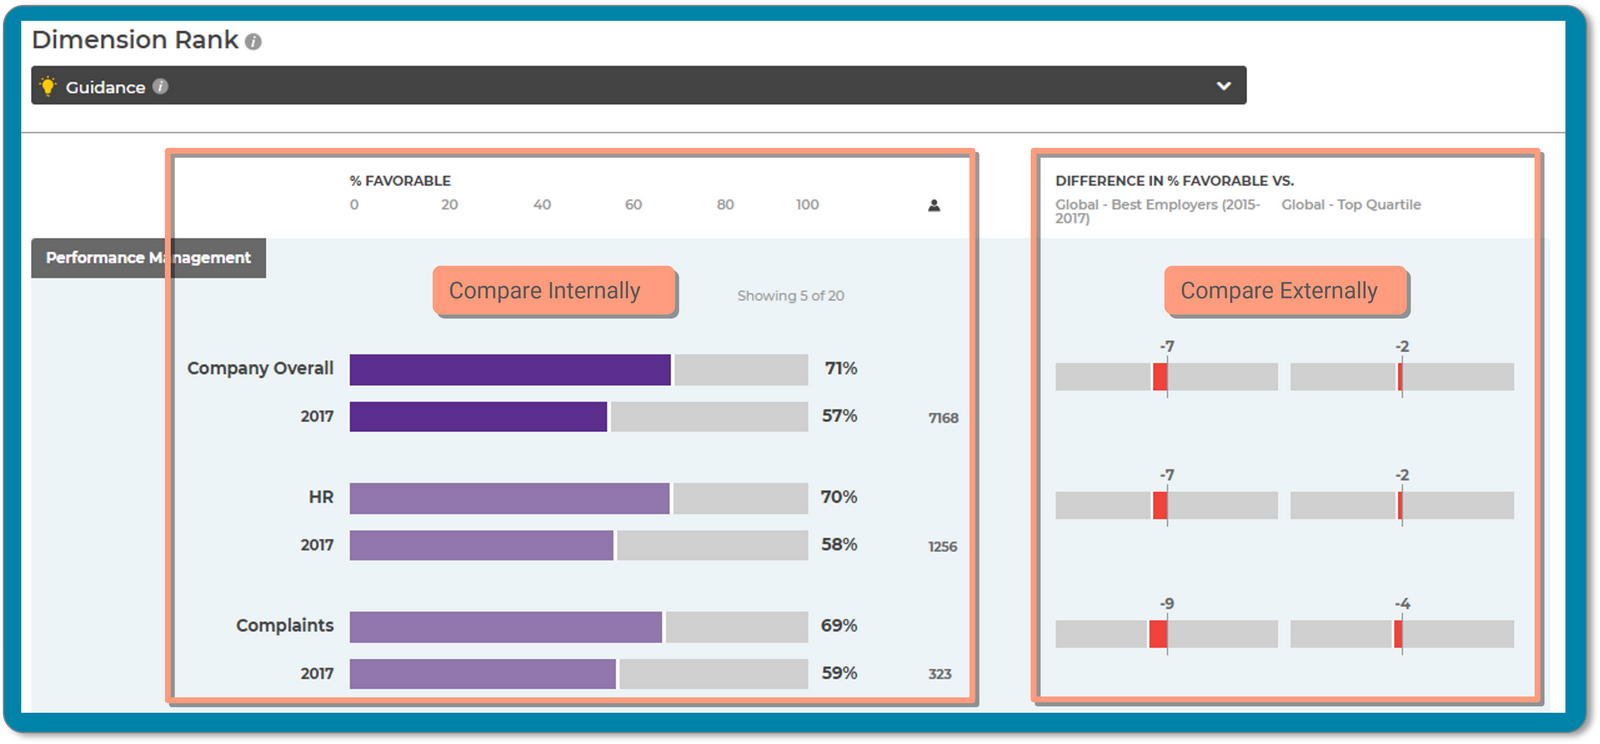
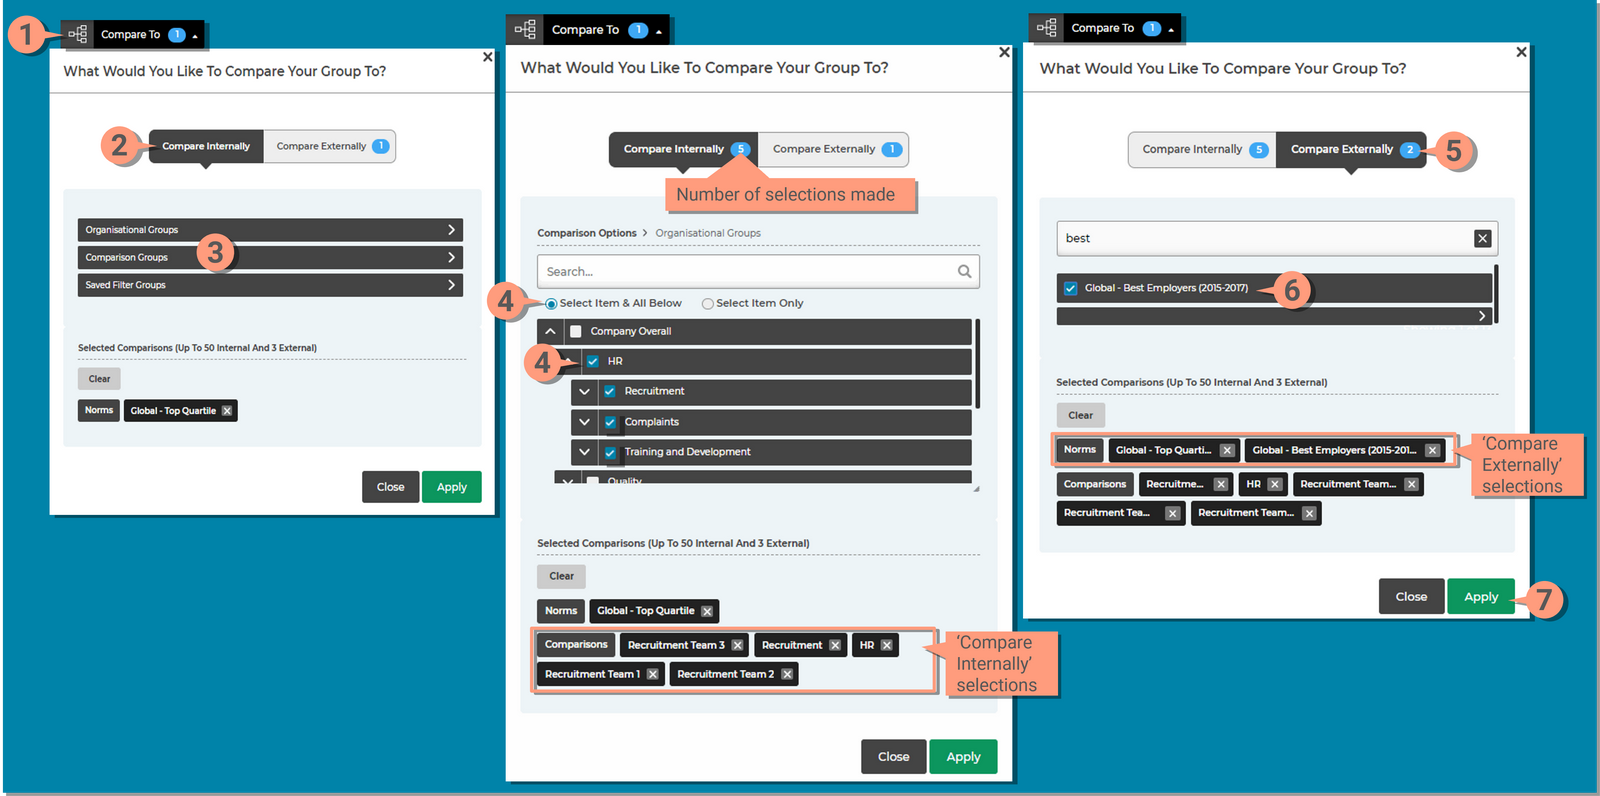
On Learn and in the modals on the Dashboard, you will find a “Compare To” tool that allows you compare your group’s results against:

  • Internally: Other organizational units that you have access to (may be your span of control, parent group, or overall organization)
  • Externally: Kincentric’s external benchmarks


How to use the 'Compare To' menu

  1. Click the Compare To menu
  2. Compare Internally tab will allow you to select other organizations to compare to the group chosen in the Filter Selector tool
  3. Select the type of Comparison Group you want to use
  4. Select the Comparison
    • When Select Item & All Below is selected, simply click the top level of the hierarchy and all organizations below will automatically be checked for you
    • When Select Item Only is selected, only the organizations you click will be selected
  5. Click the Compare Externally tab
  6. Select up to 3 Benchmarks to compare your data to
  7. Click Apply


'Break Out Data' Selector (Segment)

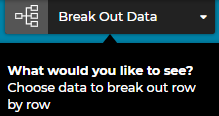
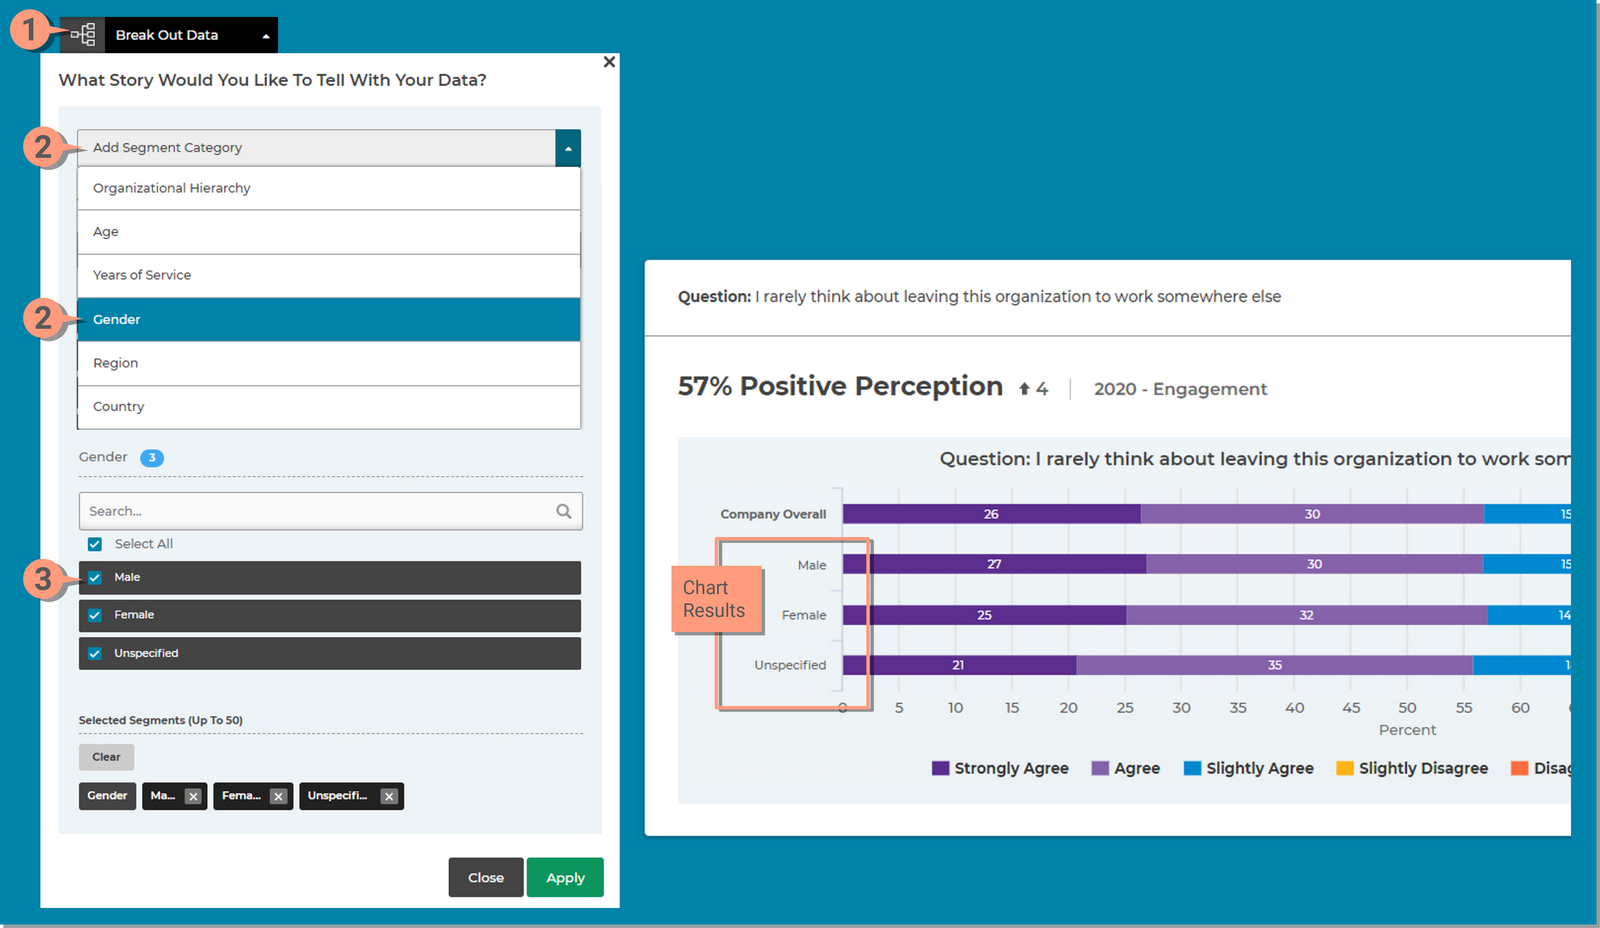
The Segment report page allows you to view results for different sub-groups within your organization using the Break Out Data tool.

  • You will not be able to filter results down to an individual respondent.

To compare scores for different sub-groups (can be organizational units or demographic/segment values):
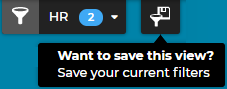
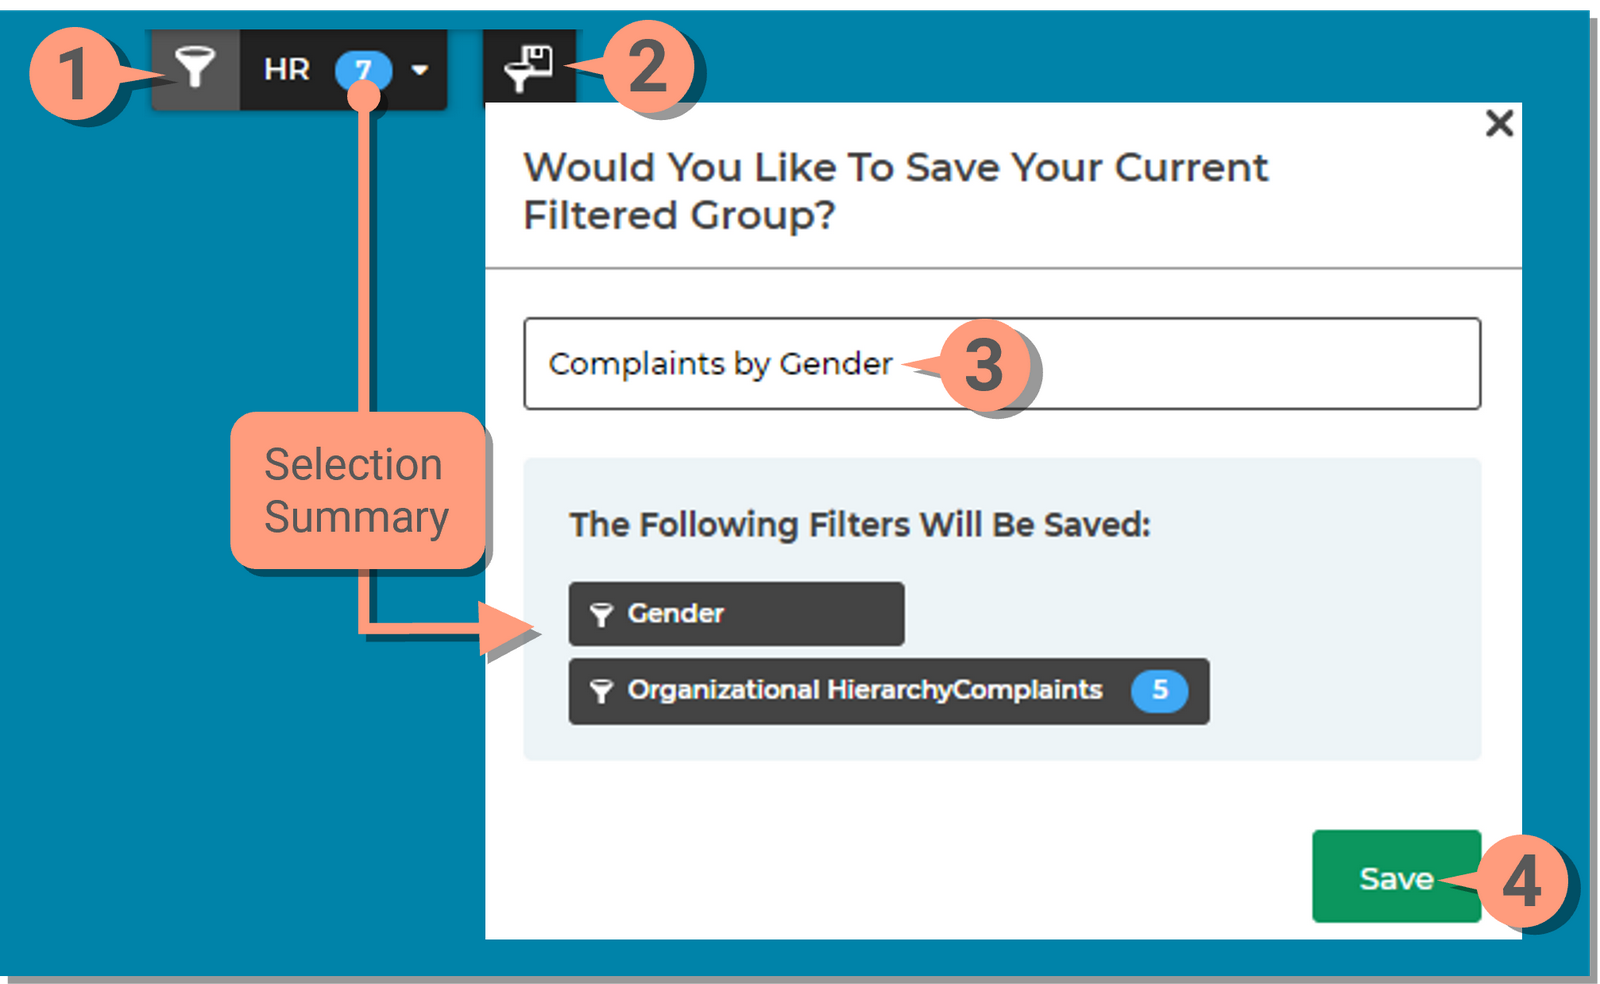
  1. Click the Break Out Data selector
  2. Select a Segment Category from the drop down menu
  3. Select the desired Demographics
    • Use the Search or Select All features to quickly find and select the desired options